In this tutorial we'll see how to create an A2B report for this example transaction portfolio to understand precisely how it has changed in value between two points in time.
A holdings report dated 7 March 2022 for this portfolio reveals that:
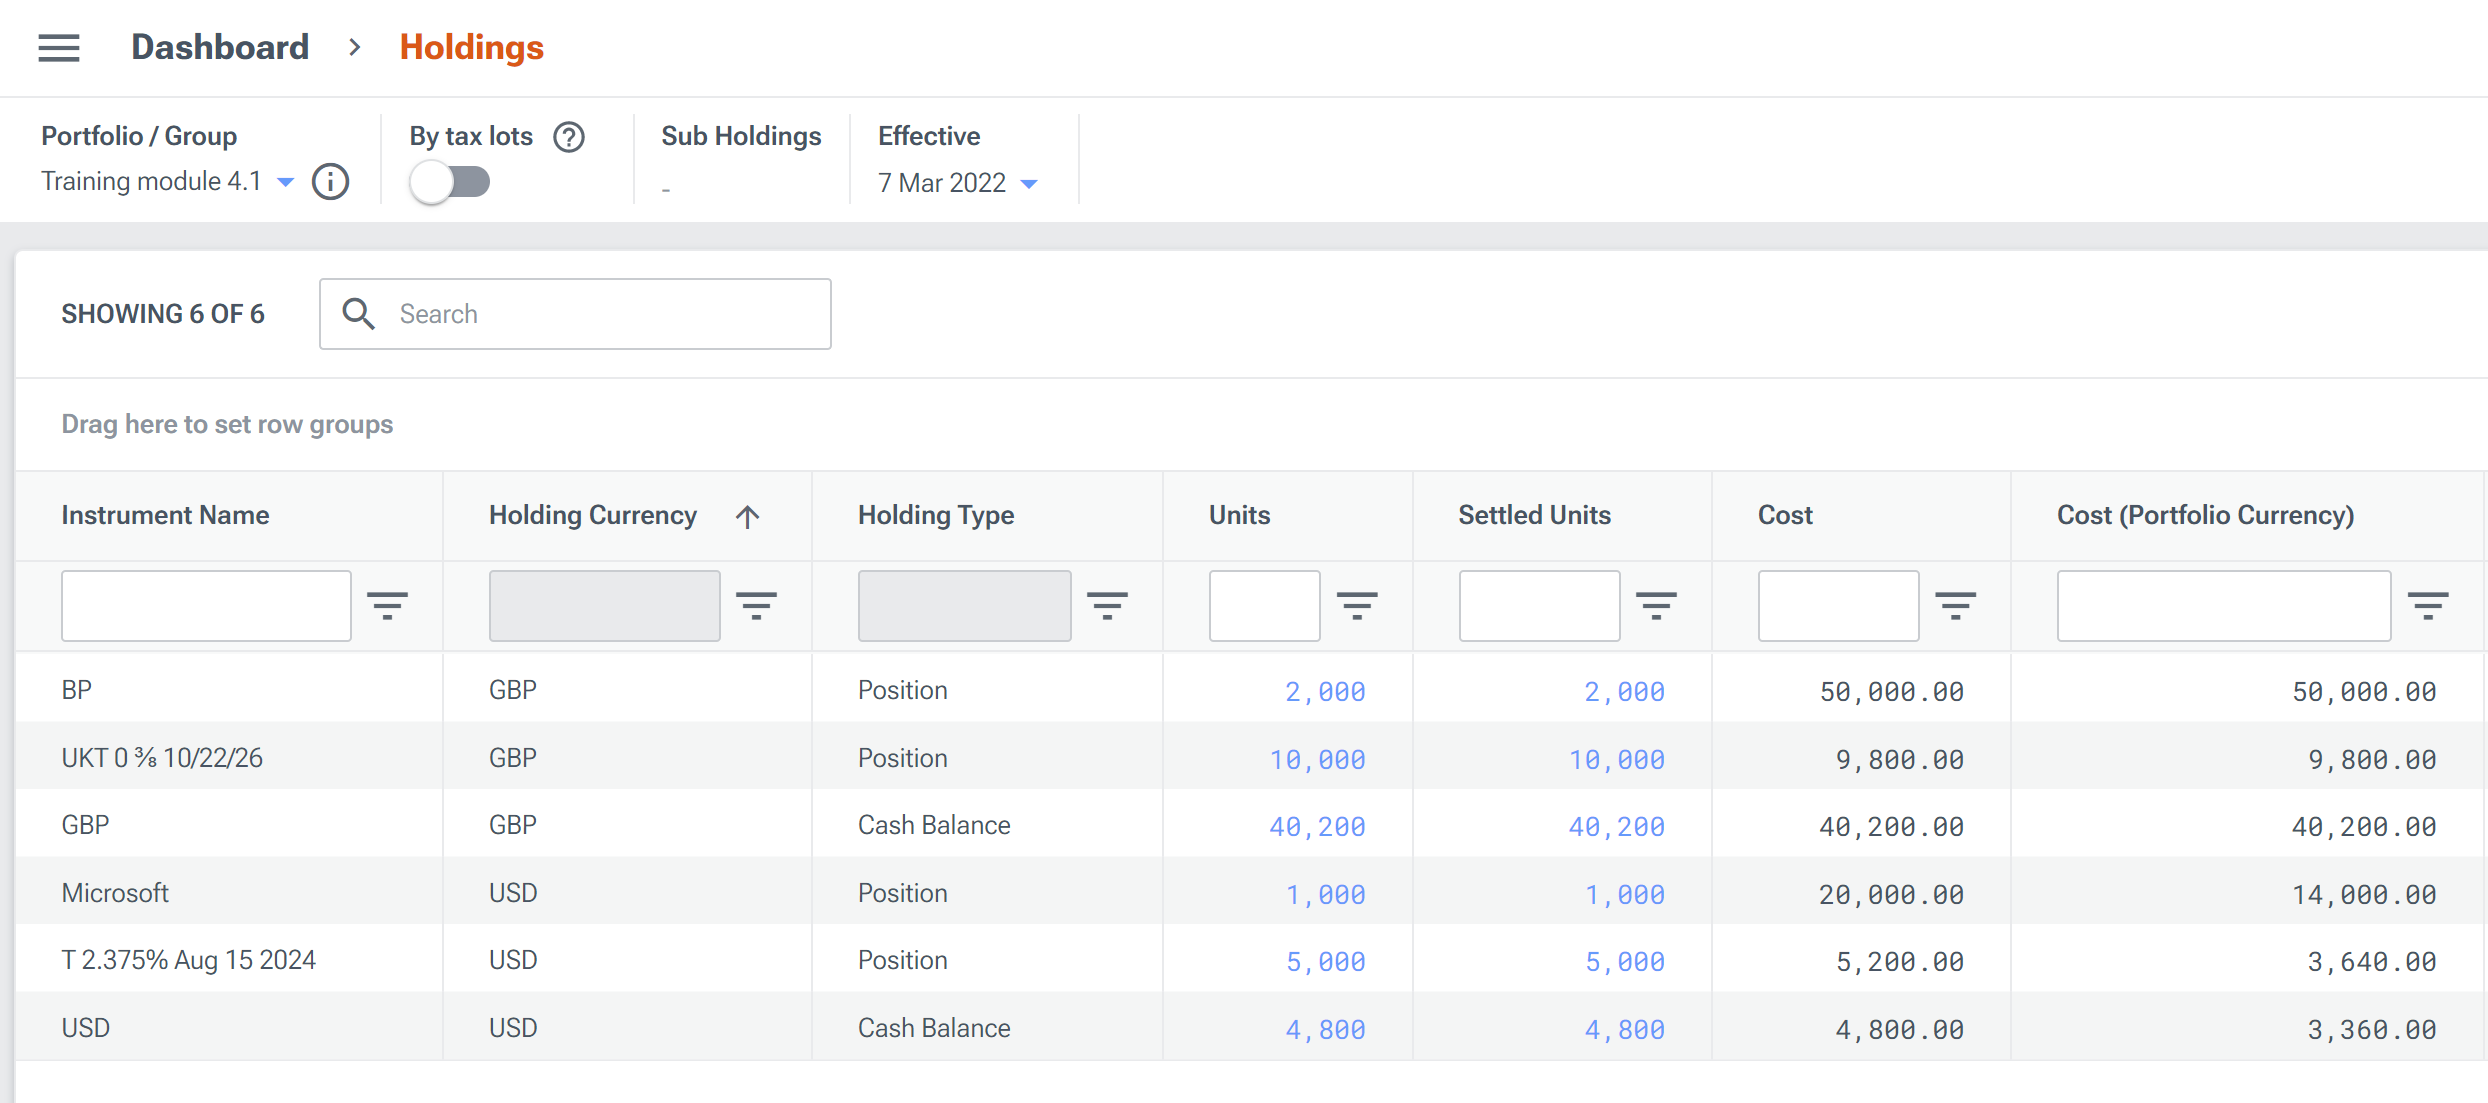
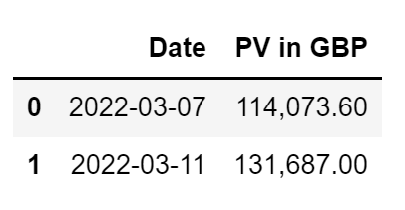
When we ask LUSID to value this portfolio on 7 March 2022, we discover it is worth £114,073.60 (aggregated in the portfolio currency). We then sell some of the USD Microsoft holding during the week and on 11 March 2022 ask LUSID to value the portfolio again using the same metrics; we discover it is now worth £131,687.00:
An A2B report helps drill down into all the activity that has contributed to the increase of £17,613.40. This could be:
Transactions that have occurred during the window, whether explicit buy or sells or implicit transactions such as dividends or fees.
Fluctuations in market prices and FX rates.
Most likely, it will be a combination of the two.
In order to generate an A2B report, we require:
Appropriate market data (market prices, FX rates and so on) loaded into a suitable LUSID store for the start and end dates of the A2B report. Note we do not need to load this data for all the intermediate days in the window.
A suitable recipe that assembles market data and specifies a pricing model and methodology to use.
See this tutorial for a detailed example of upserting market data and recipes into LUSID.
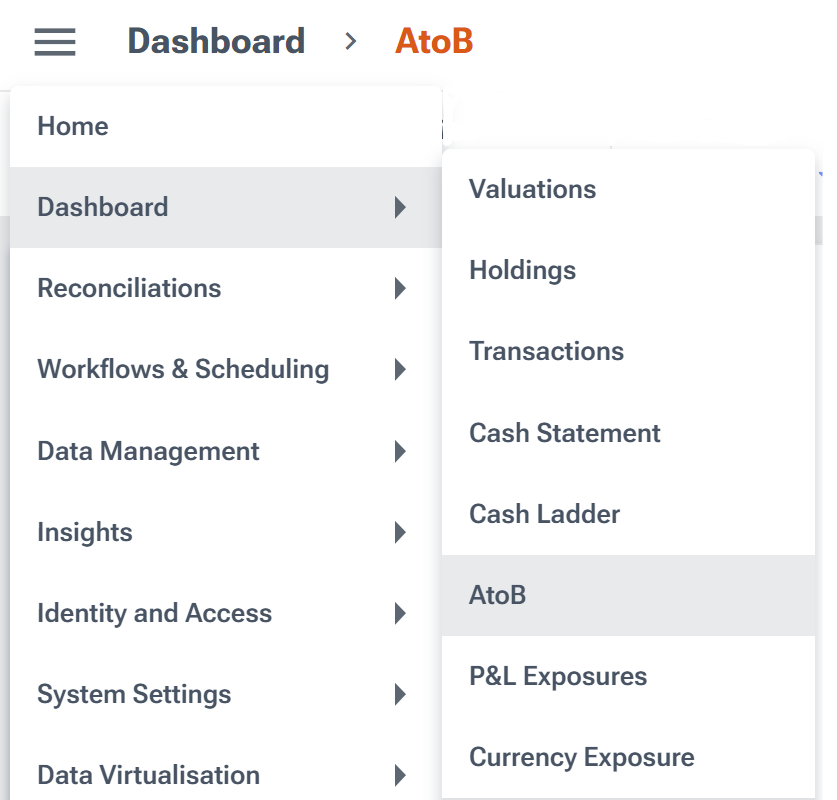
Providing we have appropriate access control permissions, we can generate an A2B report using the LUSID web app:
Alternatively, we can generate an A2B report programmatically:
Using the LUSID GetA2BData API.
Using the equivalent function in LUSID SDKs in various languages and frameworks.
Using the Luminesce Lusid.Portfolio.A2B provider.
Understanding the A2B calculation
For each holding in a portfolio, an A2B report performs the following calculation, in both the holding and portfolio currencies:
...where:
Start Valueis the market value of the holding at the start of the window. This can be zero if, for example, we first transact in the underlying instrument during the window.Flowsare transactions that result in increases or decreases in the quantity of the holding.Gainsare capital gains or losses caused by market price and/or FX fluctuations. These are classified as either:Realized in that we (for example) sell some of our holding during the window.
Unrealized in that we do not and therefore gains/losses are theoretical and based on price or FX fluctuations.
LUSID reports delta market price and delta currency (FX) gain separately, so we can track the cause of capital gain/loss. By default, cross gain is included in price gain, though there should soon be an option to report cross gain as included in FX gain.
Carryis income (for example, dividend or accrual) or expense (for example, management or transaction fee) activity.End Valueis the market value of the holding at the end of the window.
Note: LUSID generates a standard A2B report out-of-the-box but we can change the way information is reported by configuring transaction types, in particular using the dedicated movement types for A2B reports.
Generating an A2B report for the example portfolio
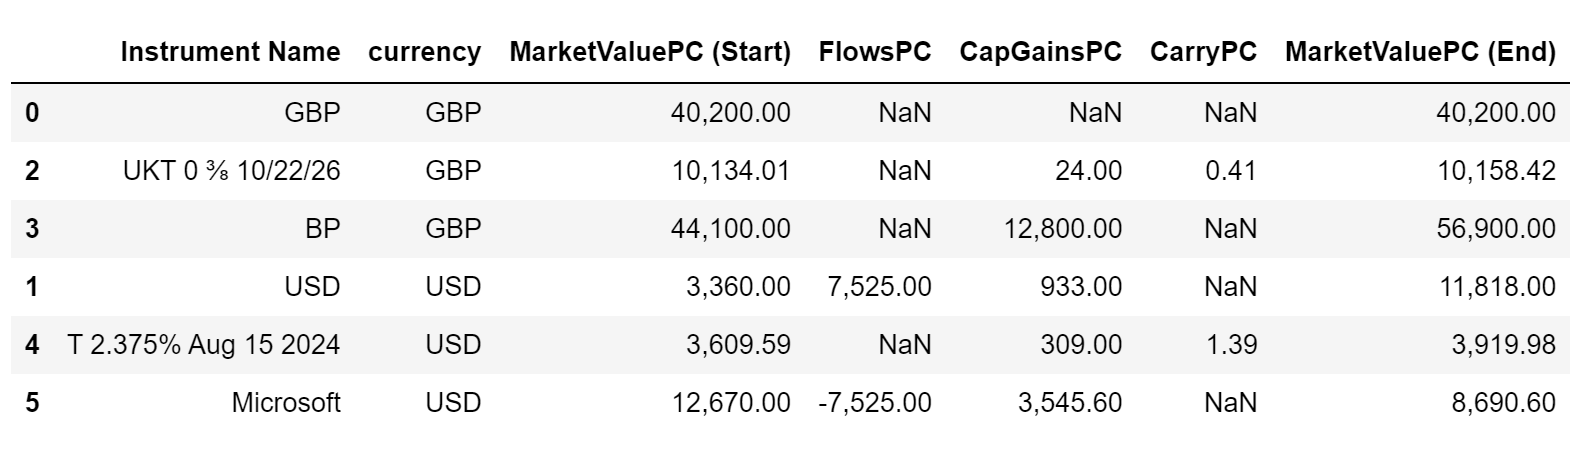
An A2B report generated in the LUSID web app for the example portfolio above starting 7 March 2022 and ending 11 March 2022 looks like this:
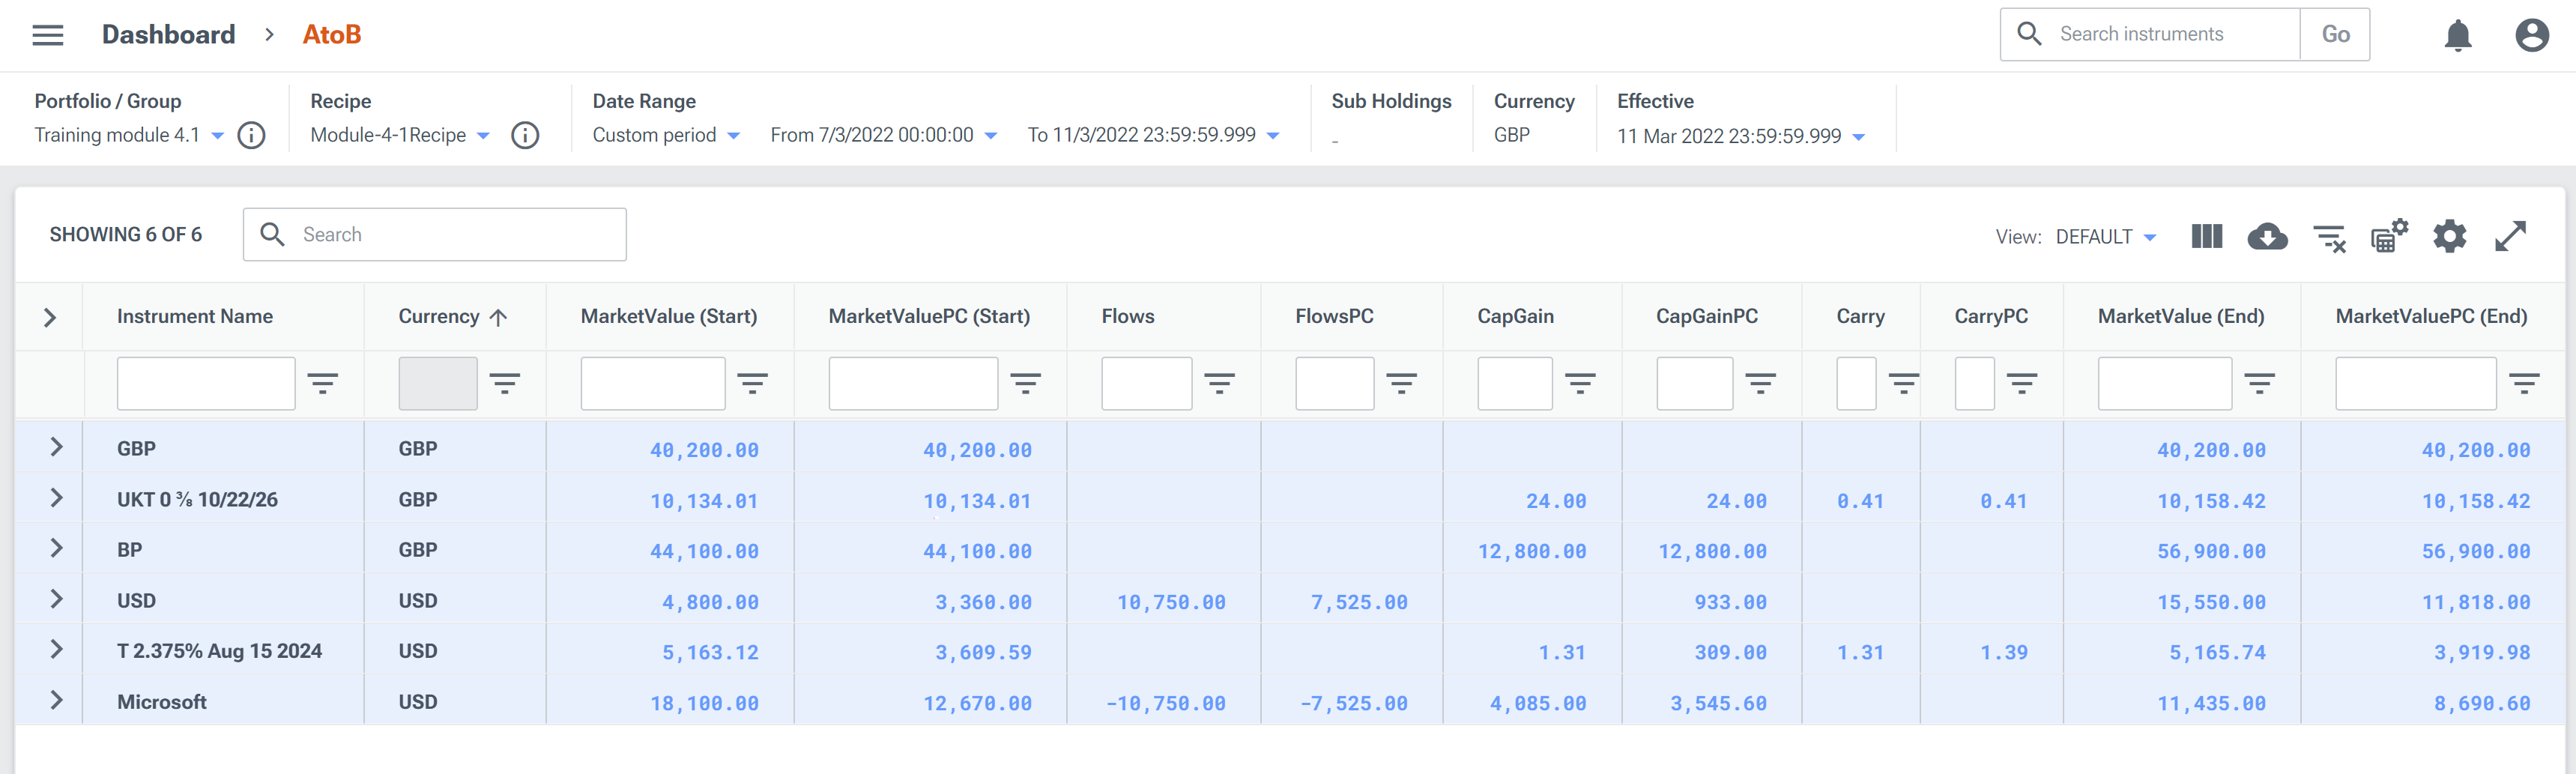
We can see that:
The figure columns represent, from left to right,
Start Value,Flows,Gains,CarryandEnd Value. Each column is duplicated: one for the holding currency and one (with a PC suffix) for the portfolio currency. Note you may need to re-arrange columns to see them as they are here.You can click on the arrow to the left of a holding to expand the row and see more information.
There is currently no total row summing the values in each column to calculate totals for the portfolio as a whole. However, you can easily perform this aggregation yourself if you generate an A2B report using an SDK.
GBP currency holding
We can see that the start value and the end value are the same (£42,000) and that there has been no activity of any type during the window:
UKT 0 3/8 10/22/26 bond holding
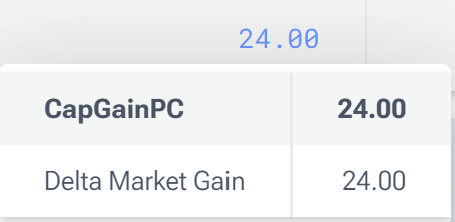
We can see that the holding increased in value by £24.41. Expanding the row reveals that:

There were no transactions affecting the underlying instrument (no value in the FlowsPC column).
Hovering over the value in the CapGainPC column reveals the gain is due to an increase in market price:
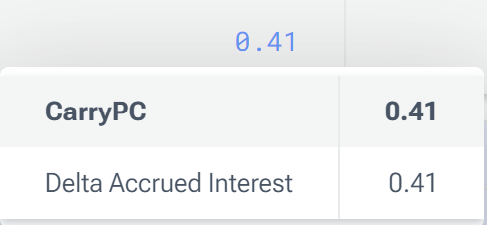
Hovering over the value in the CarryPC column reveals the income is accrued interest:
BP equity holding
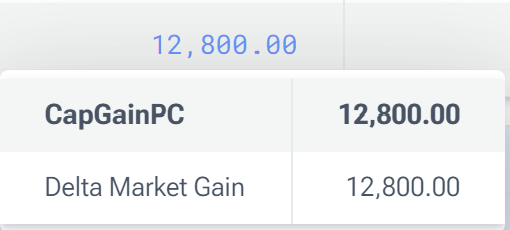
We can see that the holding increased in value by £12,800. Expanding the row reveals that:

There were no transactions affecting the underlying instrument (no value in the FlowsPC column).
Hovering over the value in the CapGainPC column reveals the gain is due to an increase in market price:
USD currency holding
We can see that the holding increased in value by £8,458 (in the portfolio currency). Expanding the row (and showing only the PC columns to normalise USD to GBP) reveals that:
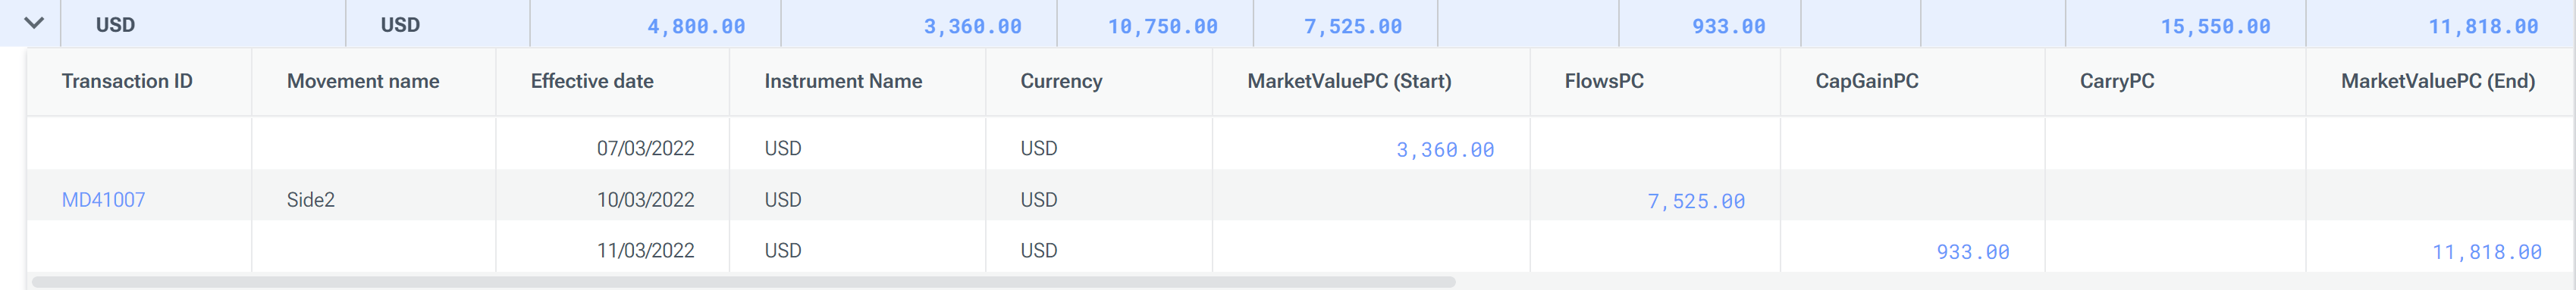
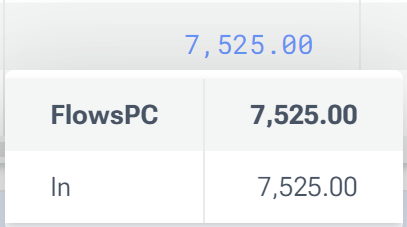
A transaction occurred during the window (with an ID of
MD41007and using the built-in sideSide2). Hovering over the value in the FlowsPC column reveals the transaction resulted in a flow in to the instrument:
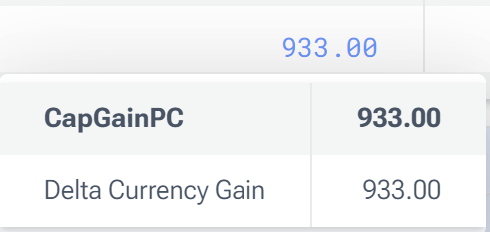
Hovering over the value in the CapGainPC column reveals the gain is due to an increase in the value of USD relative to GBP:
T 2.375% Aug 15 2024 bond holding
We can see that the holding increased in value by £310.39 (in the portfolio currency). Expanding the row (and showing only the PC columns to normalise USD to GBP) reveals that:

There were no transactions affecting the underlying instrument (no value in the FlowsPC column).
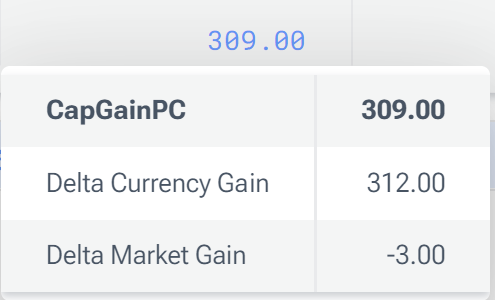
Hovering over the value in the CapGainPC column reveals that, while the holding lost value due to a decrease in market price, it gained overall due to an increase in the value of USD relative to GBP:
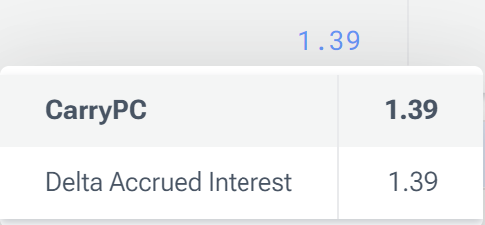
Hovering over the value in the CarryPC column reveals the income is accrued interest:
Microsoft equity holding
We can see that the holding decreased in value by -£3,979.40 (in the portfolio currency). Expanding the row (and showing only the PC columns to normalise USD to GBP) reveals that:
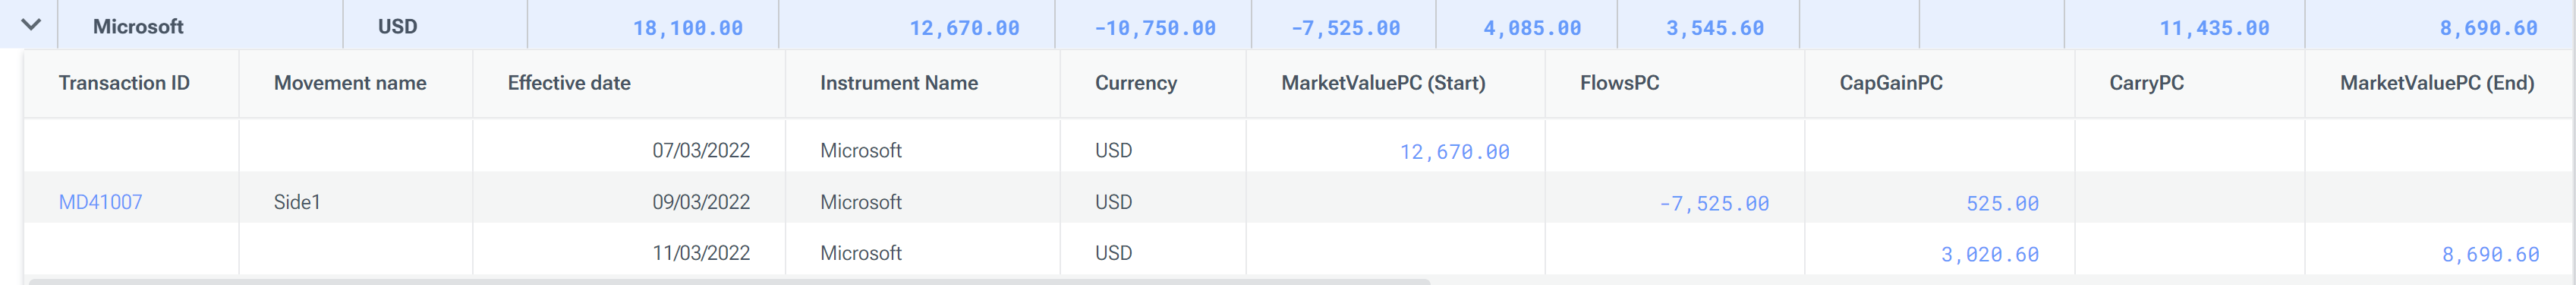
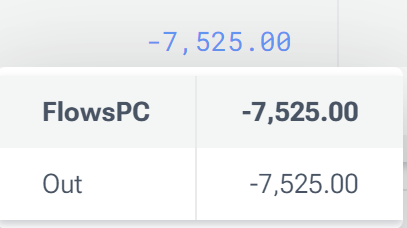
A transaction occurred during the window (with an ID of
MD41007and using the built-inSide1; this is the counterpart to the USD transaction above). Hovering over the value in the FlowsPC column reveals the transaction resulted in a flow out of the instrument:
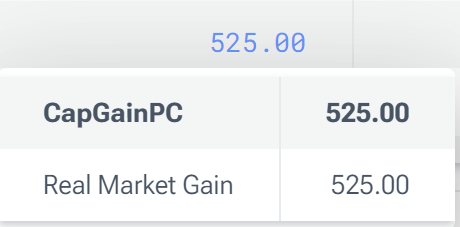
Hovering over the values in the CapGainPC column reveals:
On 9 March there was a realized gain due to an increase in market price:
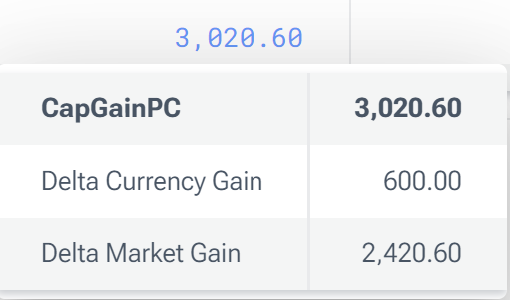
By 11 March there has been an unrealized gain for the remainder of the holding due to both an increase in market price and in the value of USD relative to GBP:
Aggregating values to calculate totals for a portfolio as a whole
The LUSID web app does not currently show a total row summing the values in each column to calculate totals for the portfolio as a whole. However, you can easily aggregate yourself if you generate an A2B report using a LUSID SDK.
For example, the following code generates the same A2B report for the example portfolio above using the LUSID Python SDK:
We can use the Pandas sum function to calculate totals for each column (note it only makes sense to sum columns normalised to the portfolio currency):
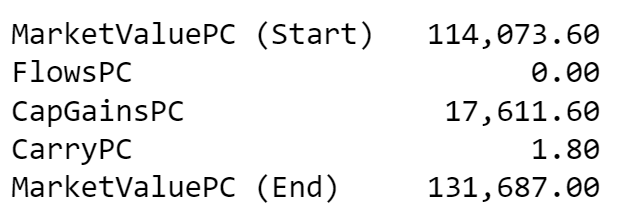
We can see the FlowsPC total is zero; the flow in of £7,525 to the USD holding and the flow out of -£7,525 from Microsoft cancel each other.