In this tutorial we'll see how to use LUSID to perform the following task:
“As a portfolio manager with a mix of equities and bonds in different regions, I want to load market data from multiple providers and track the performance of my fund over time as prices and rates change.”
We'll see how to:
Purchase assets in multiple currencies while maintaining the cost basis of the portfolio in a single currency.
Load equity and bond prices and FX spot rates from different financial data vendors into the LUSID Quote Store.
Create a recipe that locates this market data, specifies a pricing model, and handles missing quotes.
Decide which of the many LUSID valuation metrics are useful to include in our report.
Value instrument positions (holdings) individually in the portfolio each day, using FX rates to normalise foreign currency holdings to the portfolio currency.
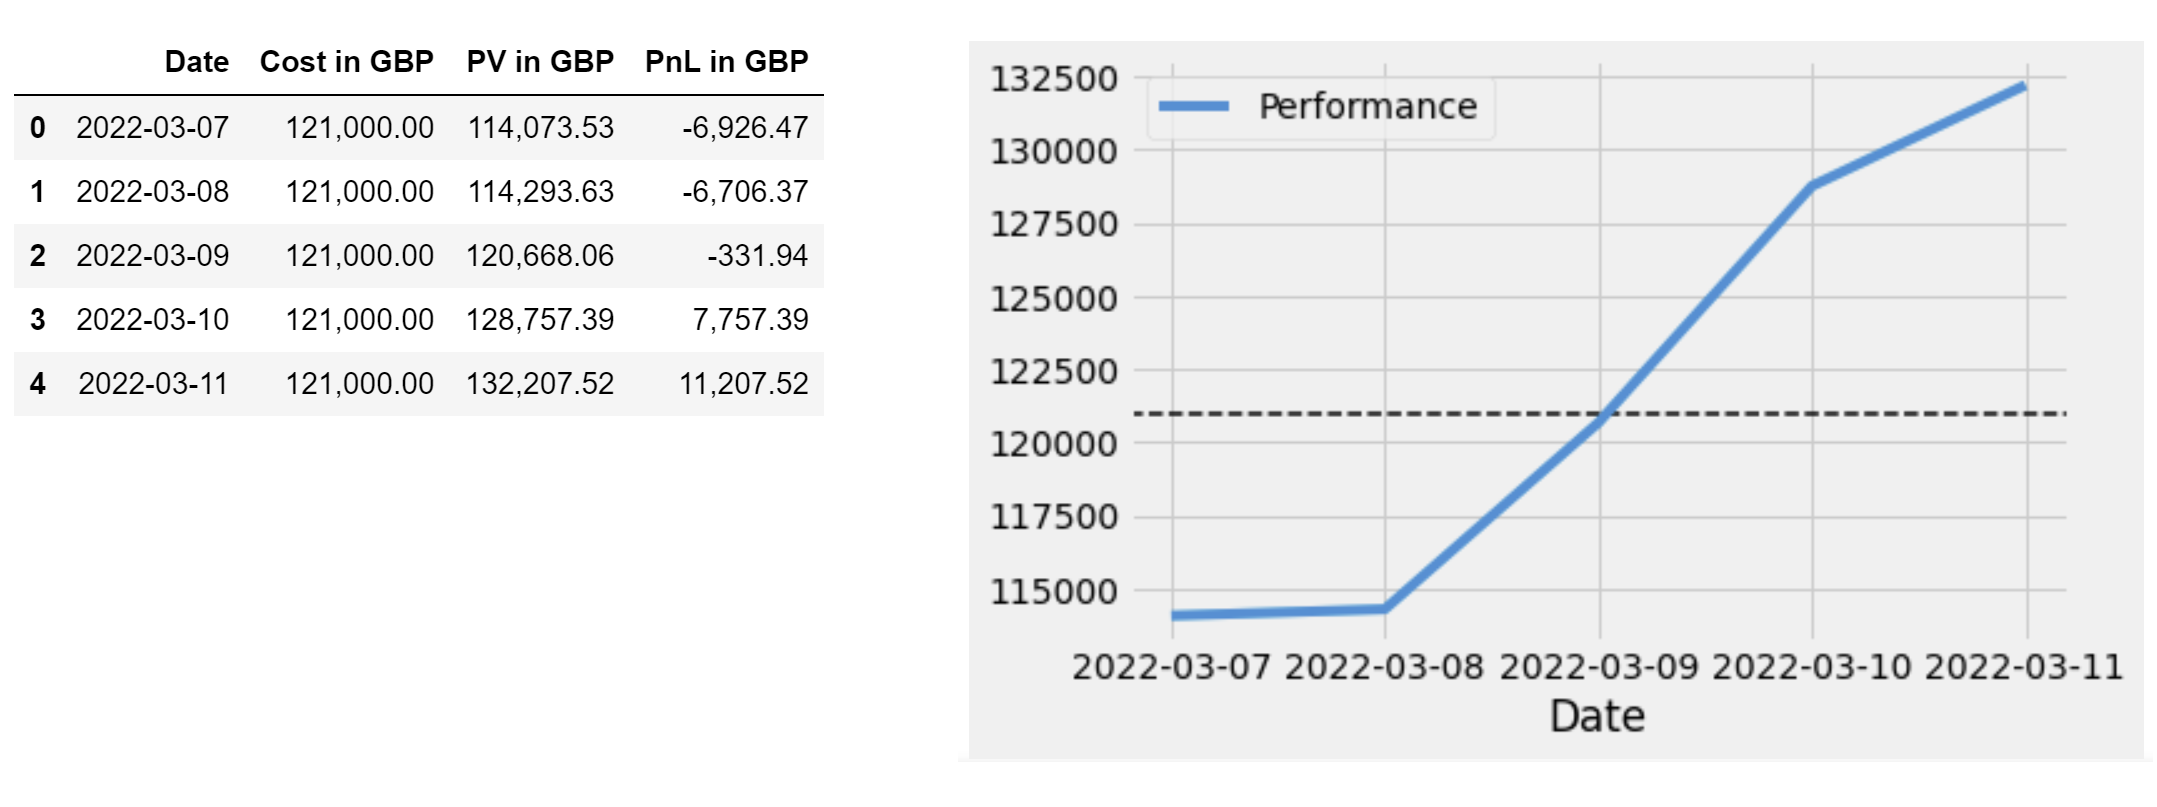
Sum holding results to value the portfolio as a whole each day, and calculate PnL (ie. performance) over a week.
You can examine and run the complete code sample for this exercise from this Jupyter Notebook, providing you have suitable access control permissions. This can most easily be achieved by assigning your LUSID user the built-in lusid-administrator role, which should already be the case if you are the domain owner. If you are told you do not have a license to perform a particular operation, please contact support.
Examining the source files
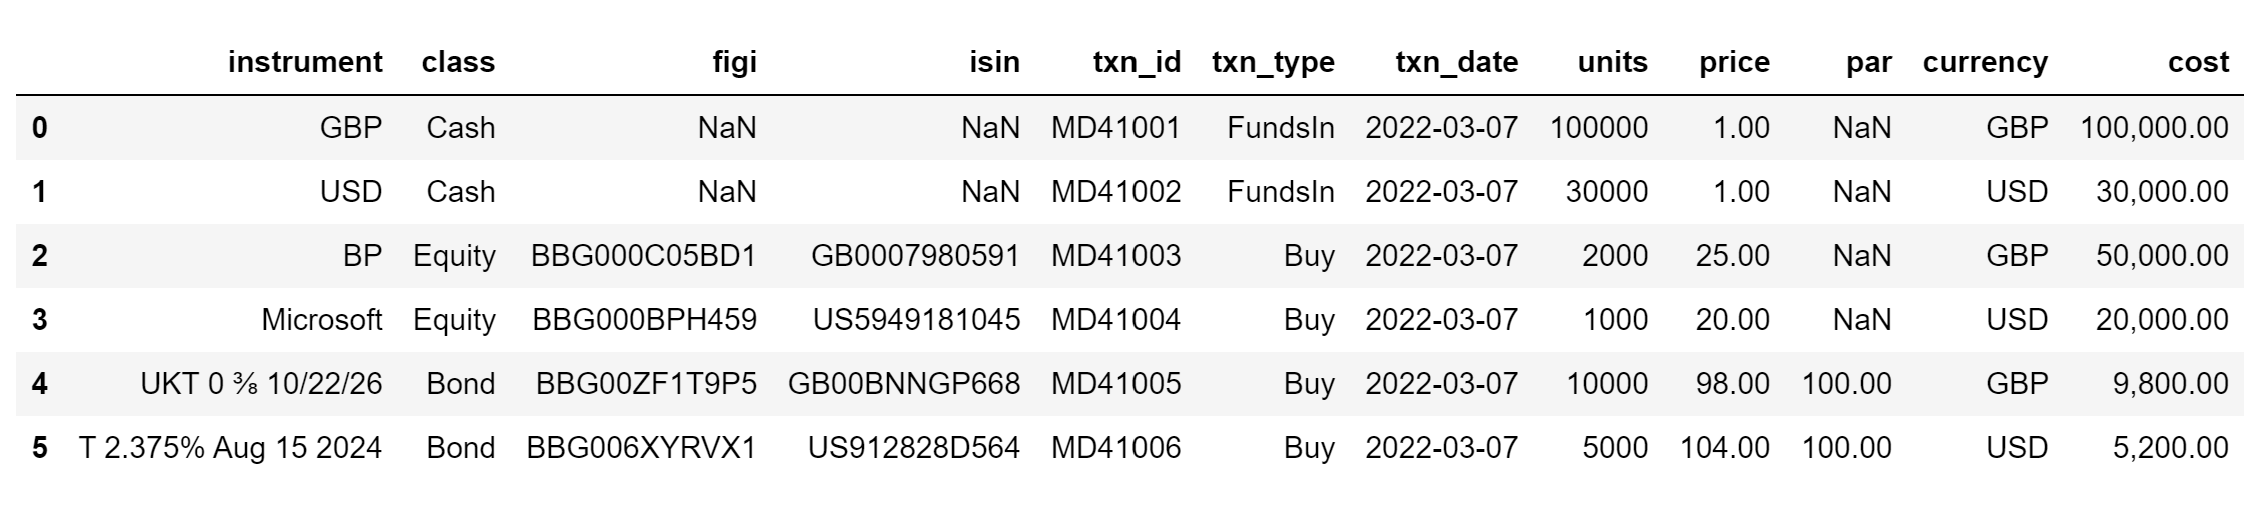
Let's assume we have a set of transactions to load into our portfolio on Monday 7 March:
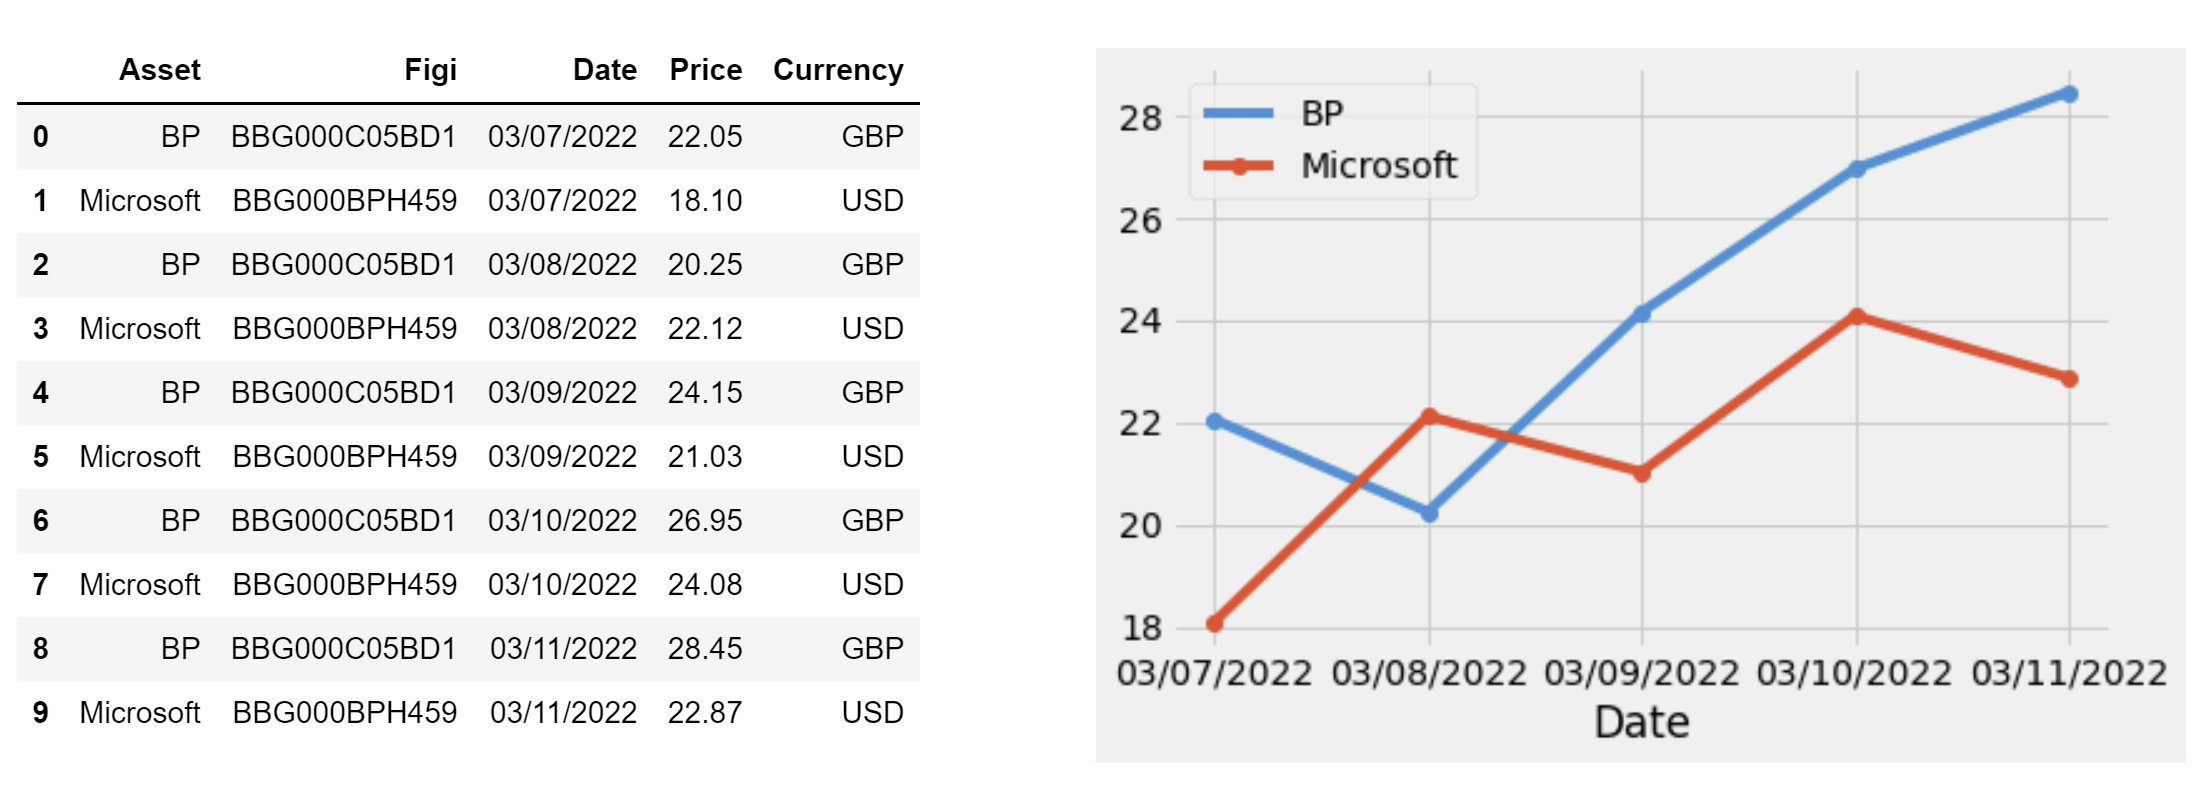
We have closing market prices for equities from EDI (keyed by FIGI identifiers) for each of the five days between Monday 7 March and Friday 11 March:
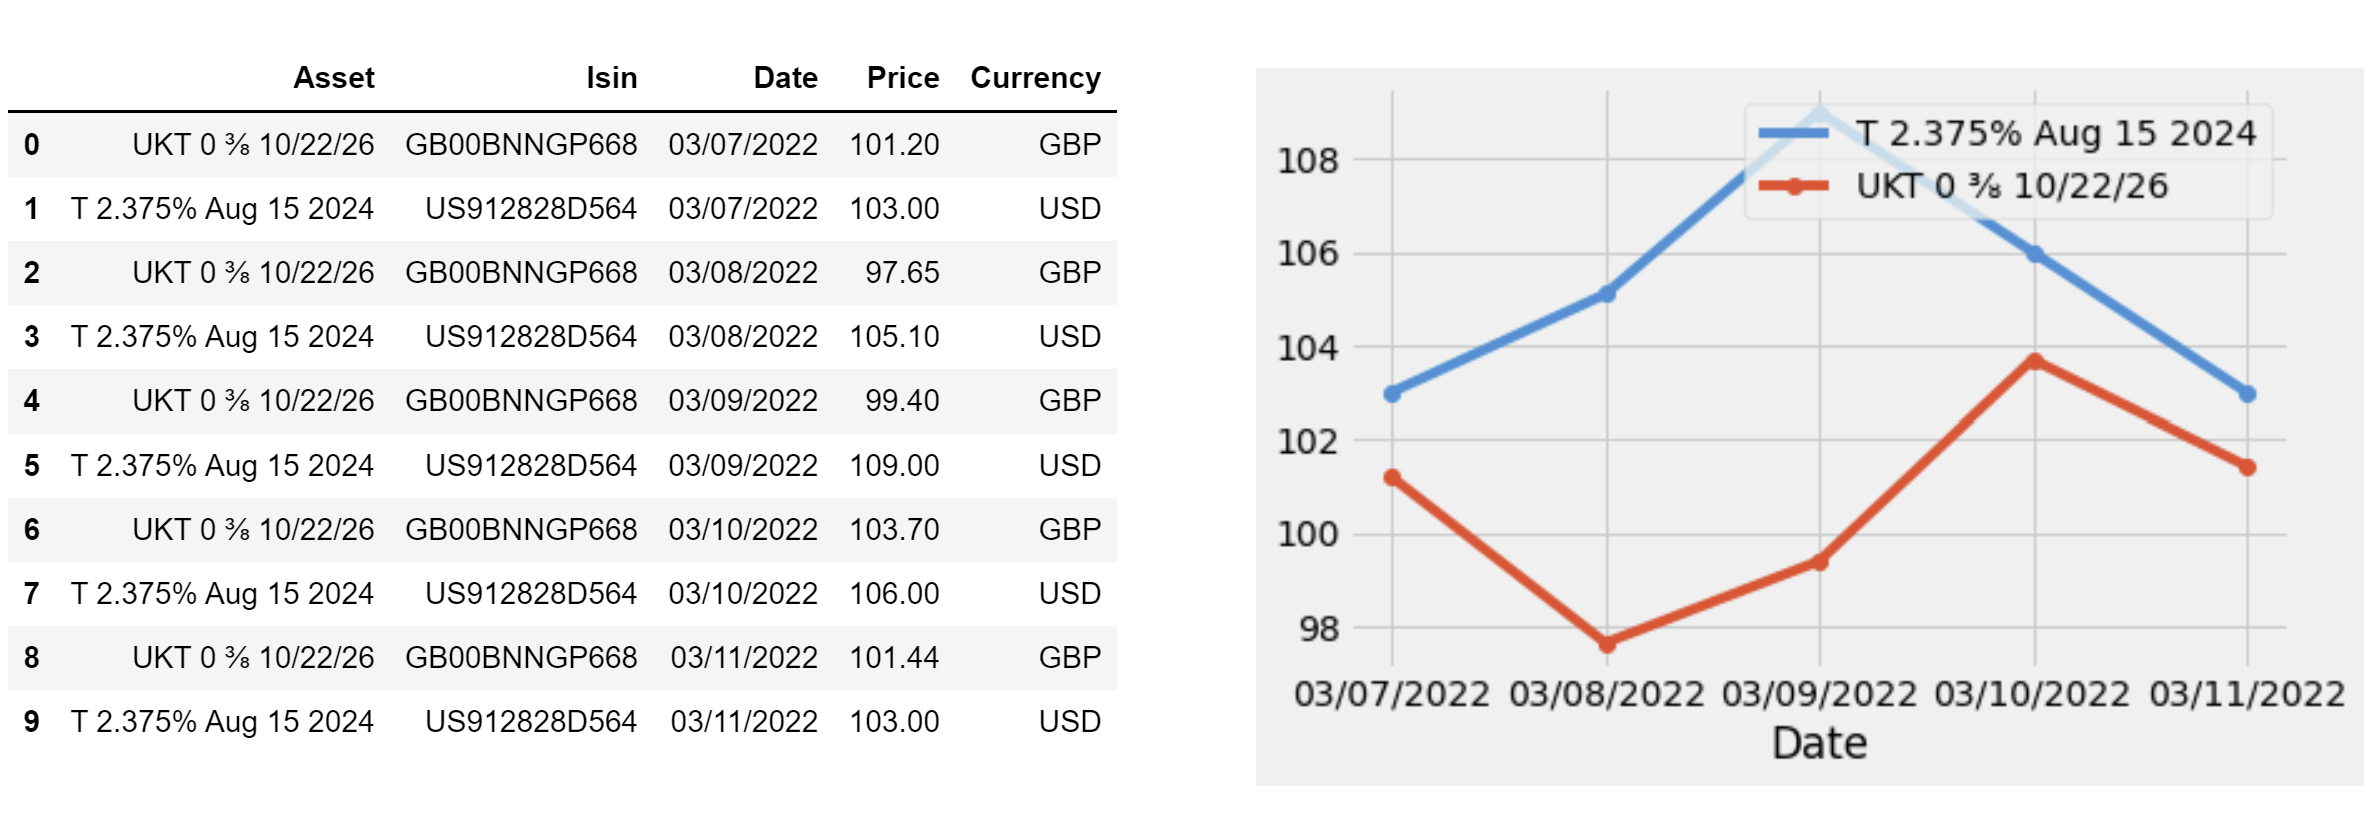
We have closing market prices for bonds from Refinitiv DataScope (keyed by ISIN identifiers) for the same 5 days:
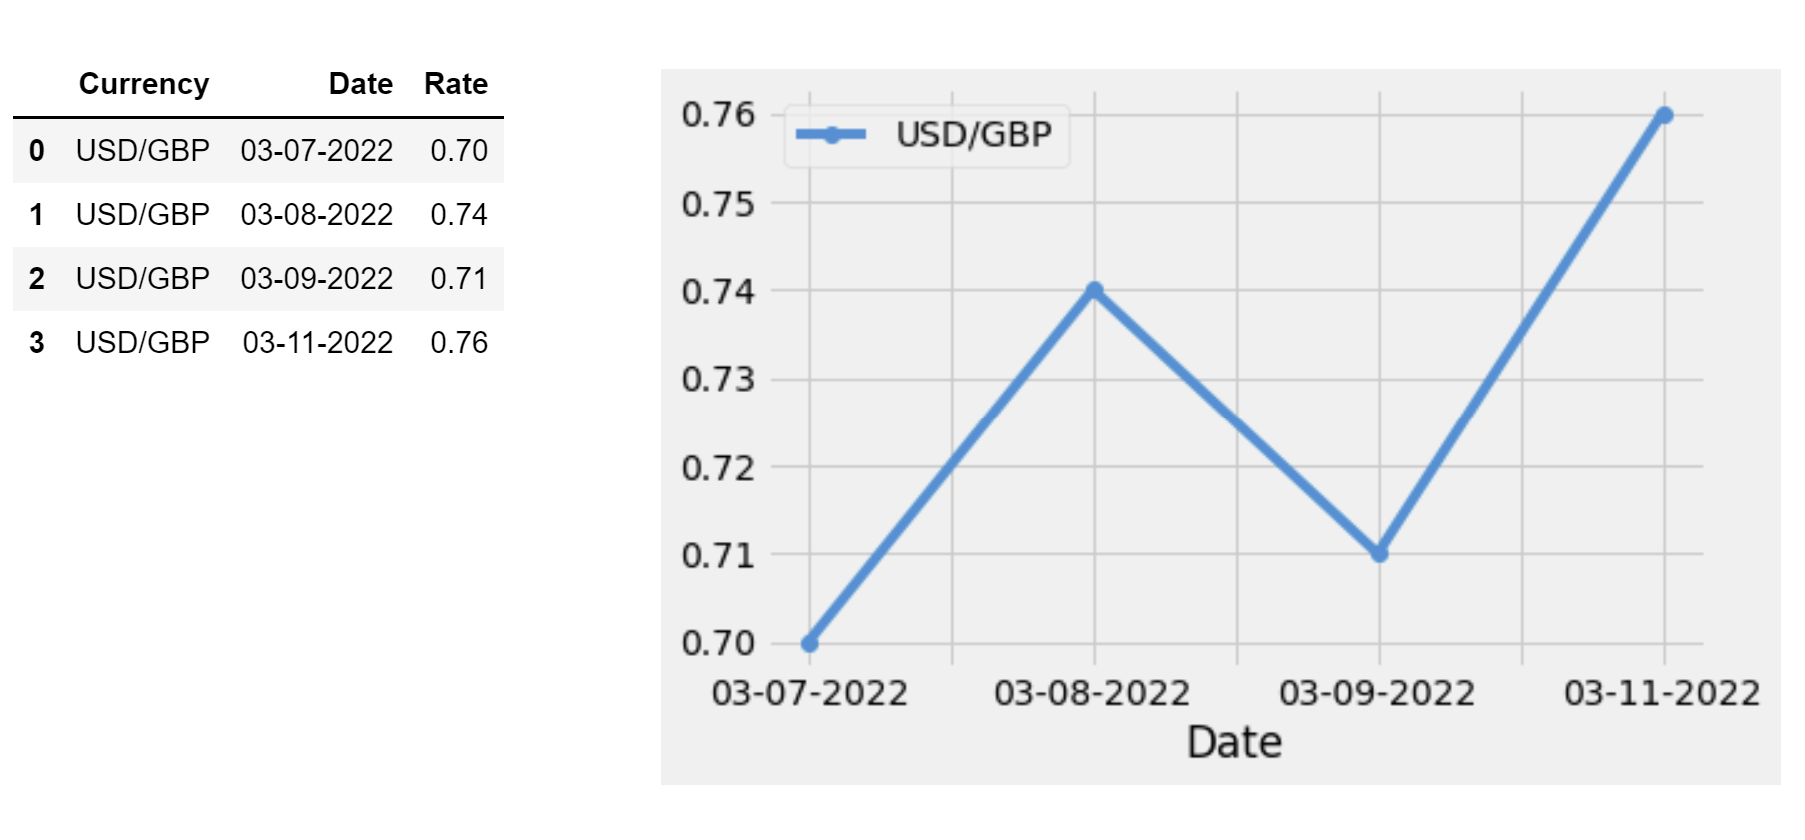
And we have closing USD/GBP spot rates for most of those days:
We can see that:
The transaction source file seeds the portfolio with initial GBP and USD cash amounts using the built-in
FundsIntransaction type.Equities and bonds are purchased in both GBP and USD using the built-in
Buytransaction type, so we can expect the cost of each transaction to be automatically deducted from the appropriate cash balance.The cost of equities and cash is calculated as the number of units bought multiplied by the purchase price in the holding currency. The cost of bonds is calculated as a percentage of par, which is purchase price divided by par multiplied by the number of units bought.
There's a USD/GBP spot rate missing, on Thursday 10 March.
Note that bond instruments must be mastered in a particular way in order for LUSID to value them correctly:
Bond instrument definitions should be unitised (the
principalset to1) and the quantity purchased specified in transactions.Coupon rates are defined as numbers rather than percentages, so a bond paying:
10% should have a
couponRateof0.12.5% should have a
couponRateof0.0250.375% should have a
couponRateof0.00375
Creating a suitable transaction portfolio
The first task is to call the LUSID CreatePortfolio API, specifying a suitable scope, code and name, and setting the base currency of the portfolio to GBP. For a general introduction to portfolios in LUSID, read our portfolio documentation.
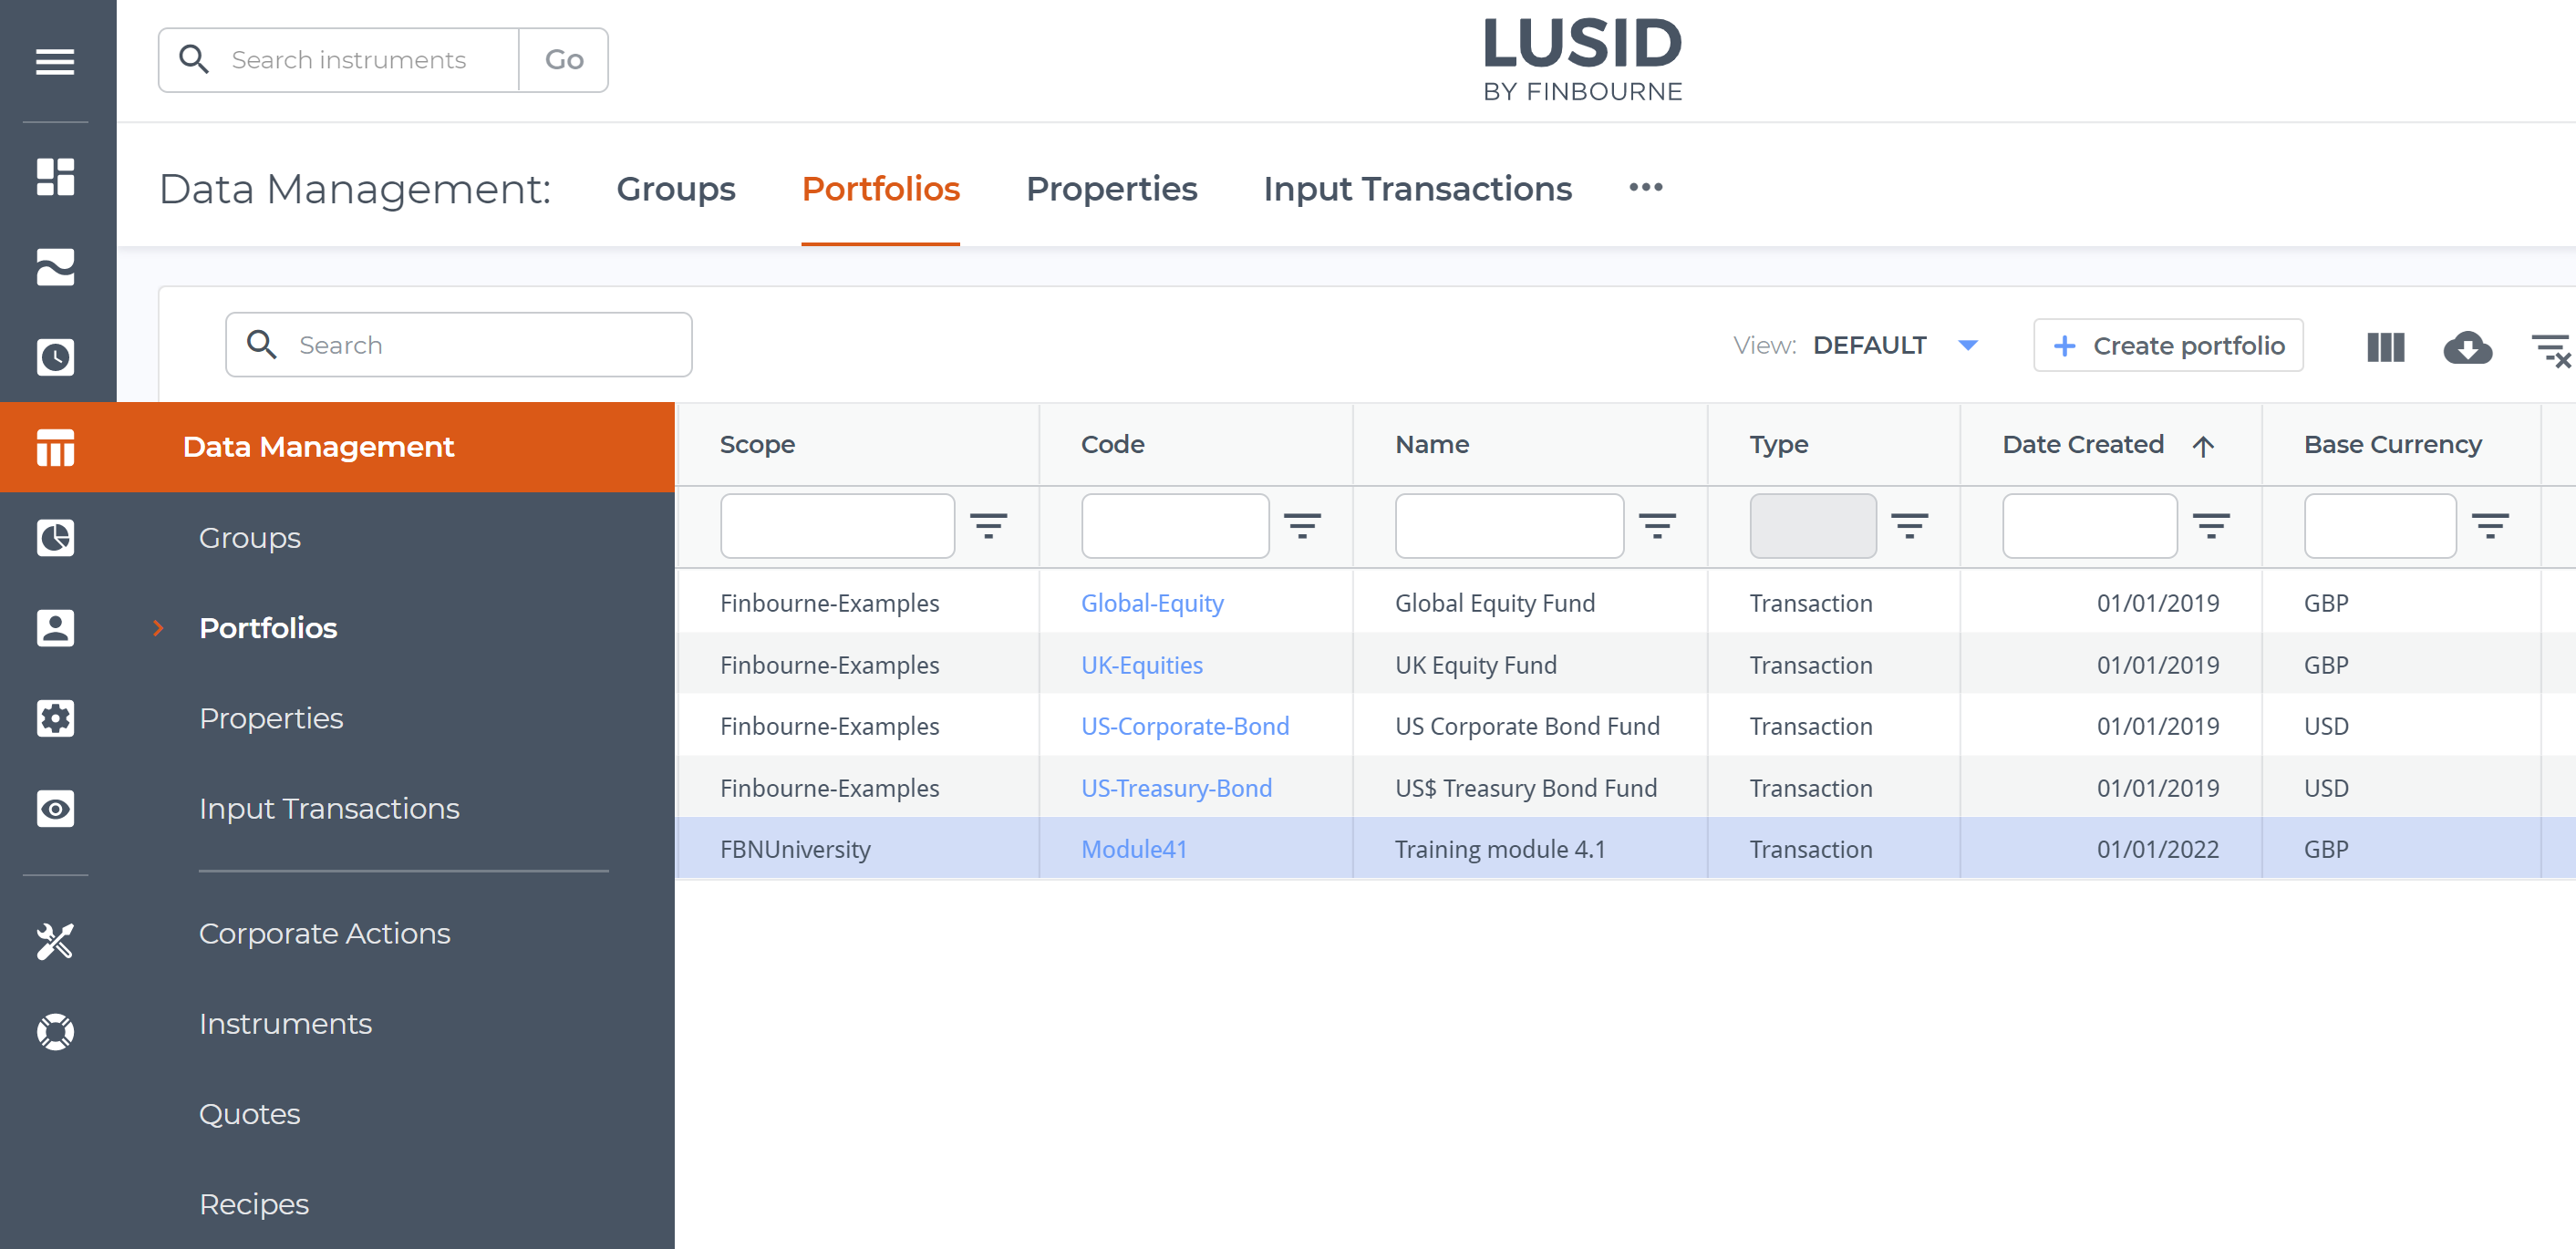
Step 3 of the accompanying Jupyter Notebook demonstrates how to do this using the LUSID Python SDK. You can execute the Notebook in Jupyterhub for your LUSID domain and then sign in to the web app to see the portfolio on the Portfolios dashboard, available from the left-hand Data Management menu:
Loading transactions into the portfolio and establishing holdings
We can call the LUSID UpsertTransactions API to load the transactions in our source file into the portfolio.
For each transaction, we record the number of units bought, the purchase price, and the total consideration (cost) in the transaction currency.
Note we purchase a US equity and bond in USD, but the base currency of the portfolio is GBP. To maintain the cost basis of the portfolio, we need to record the USD/GBP spot rate, which we can do by adding the built-in TradeToPortfolioRate system property to each. LUSID then automatically calculates the cost in GBP.
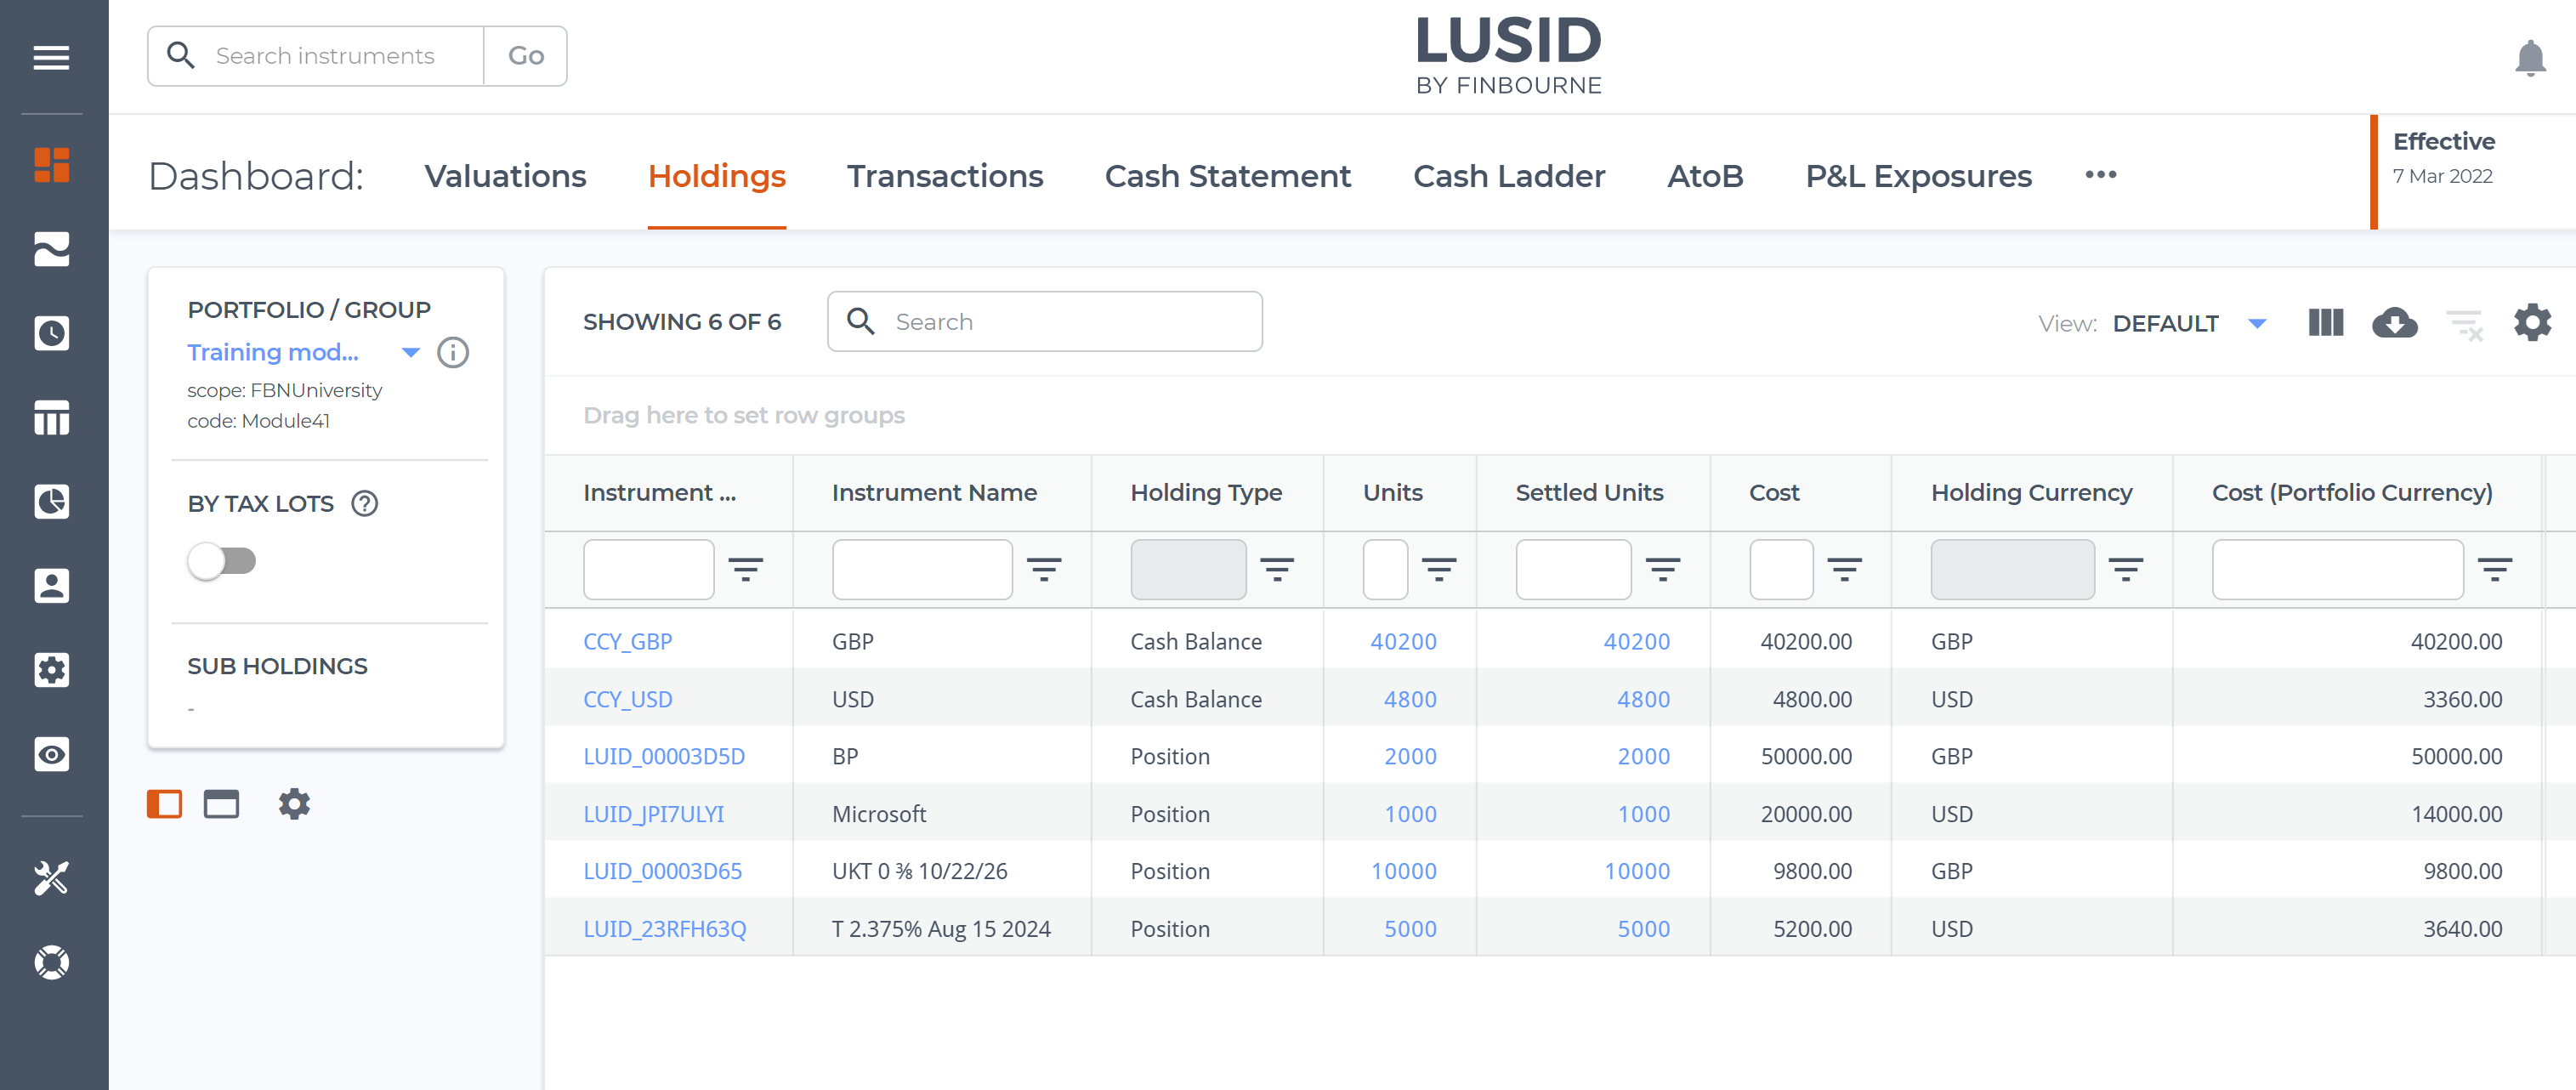
Step 4 of the accompanying Jupyter Notebook demonstrates how to do this using the LUSID Python SDK. You can execute the Notebook in Jupyterhub for your LUSID domain and then sign in to the web app to observe LUSID's holdings calculations on the Dashboard > Holdings. Note that:
The Cost column shows the cost of each holding in the Holding Currency.
The Cost (Portfolio Currency) column shows the cost in GBP for the USD transactions calculated using the trade to portfolio rate.
Loading market data into the LUSID Quote Store
LUSID has a Quote Store designed to hold simple market data such as equity and bond prices and FX spot rates. Note that for more complex market data, a different store is available.
We can call the LUSID UpsertQuotes API to load up to 2000 quotes at a time, specifying for each:
A scope, or namespace, into which to load the data.
A provider representing a financial data vendor. At the time of writing, valid providers are
Bloomberg,DataScope,SIX,FactSet,TraderMade,Edi,LusidandClient; if your provider isn't listed, you can represent it usingLusid.Optionally, a price source that indicates a sub-supplier to the financial data vendor (above), for example Tradeweb or RRPS for Refinitiv DataScope.
For equity and bond prices, an instrument identifier such as
FigiorIsinwith a value to link the quote to an instrument mastered in LUSID.For FX rates, an identifier type of
CurrencyPairand a value consisting of the buy and sell currencies separated by a forward slash, for exampleUSD/GBP.The type, for example
PriceorRate.A field, for example
midorbid.The actual price or rate amount.
Note that for each bond we also need to record the scale factor (reflecting par) to enable LUSID to value the bond properly.
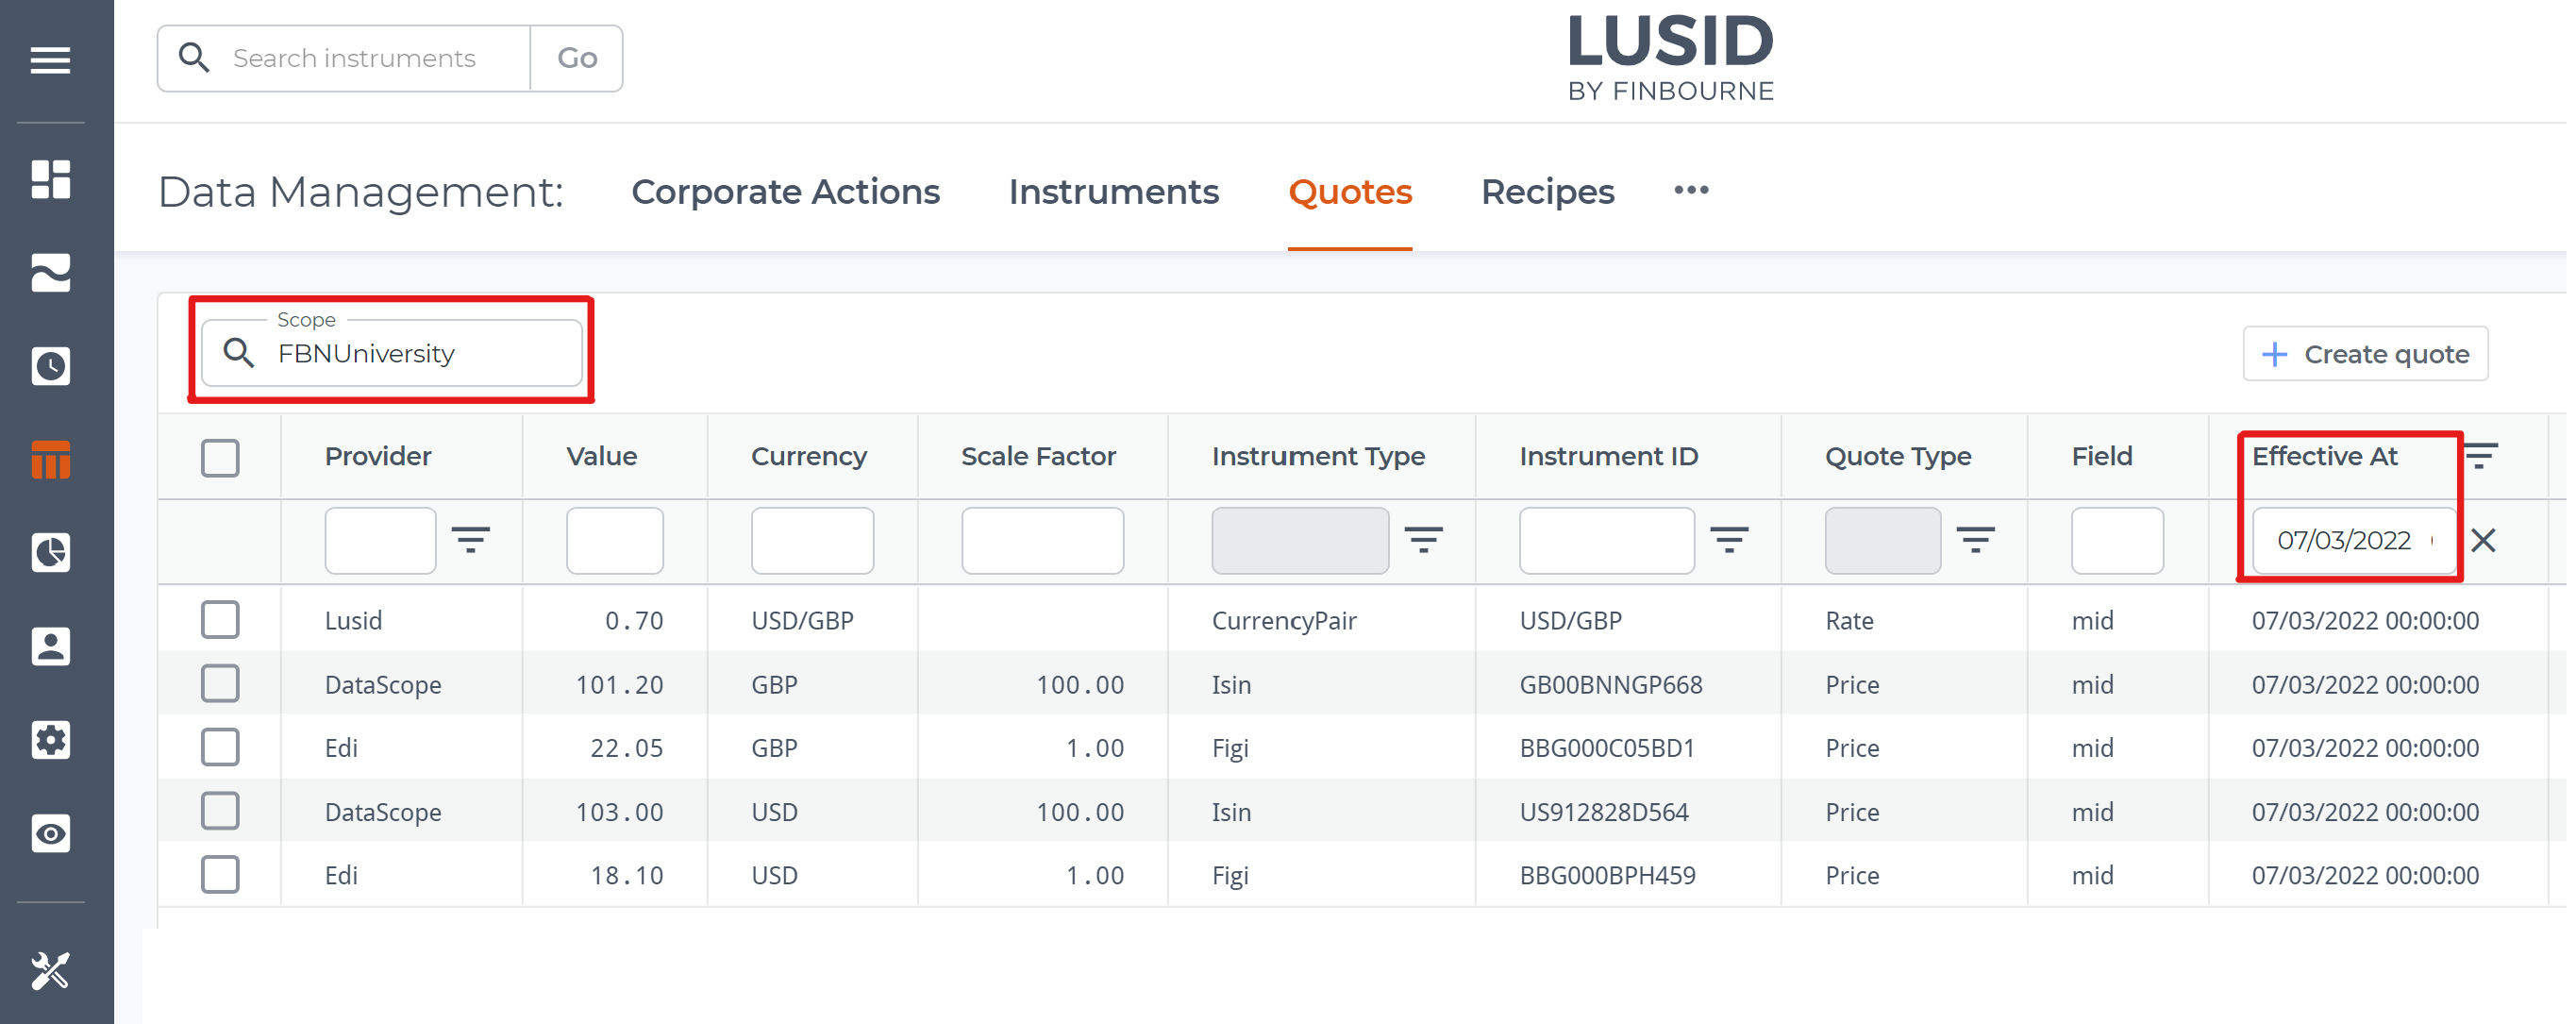
Steps 5.1 and 5.2 of the accompanying Jupyter Notebook demonstrate how to load prices and rates using the LUSID Python SDK. You can execute the Notebook in Jupyterhub for your LUSID domain and then sign in to the web app to access the Data Management > Quotes dashboard. Use the Scope dropdown (highlighted left) and the Effective At column (highlighted right) to choose one of the days between Monday 7 and Friday 11 March to see the quotes loaded for that day:
Creating a valuation recipe
To value a portfolio we must first create a recipe that tells LUSID how to locate market data in the LUSID Quote Store, and which pricing model and methodology to use.
Retrieving market data
For each of the three categories of market data we need to retrieve (equity prices, bond prices and FX spot rates), we must specify a market data rule in the recipe that tell LUSID:
The key to use to locate market data. This is a dot-separated string whose precise syntax depends on the type of data; see these examples. In our case, the keys are:
A key of
Quote.Figi.*to locate the equity prices loaded into the quote store using FIGI identifiers.A key of
Quote.Isin.*to locate the bond prices loaded using ISIN identifiers.A key of
Fx.USD.GBP.*to locate the USD/GBP spot rates.Note: If our bond prices had been loaded into the Quote Store using FIGI identifiers as well, then equities and bonds could have shared a key of
Quote.Figi.*. And we could choose to look up any FX rate usingFx.*.*, rather than specifically USD/GBP rates.
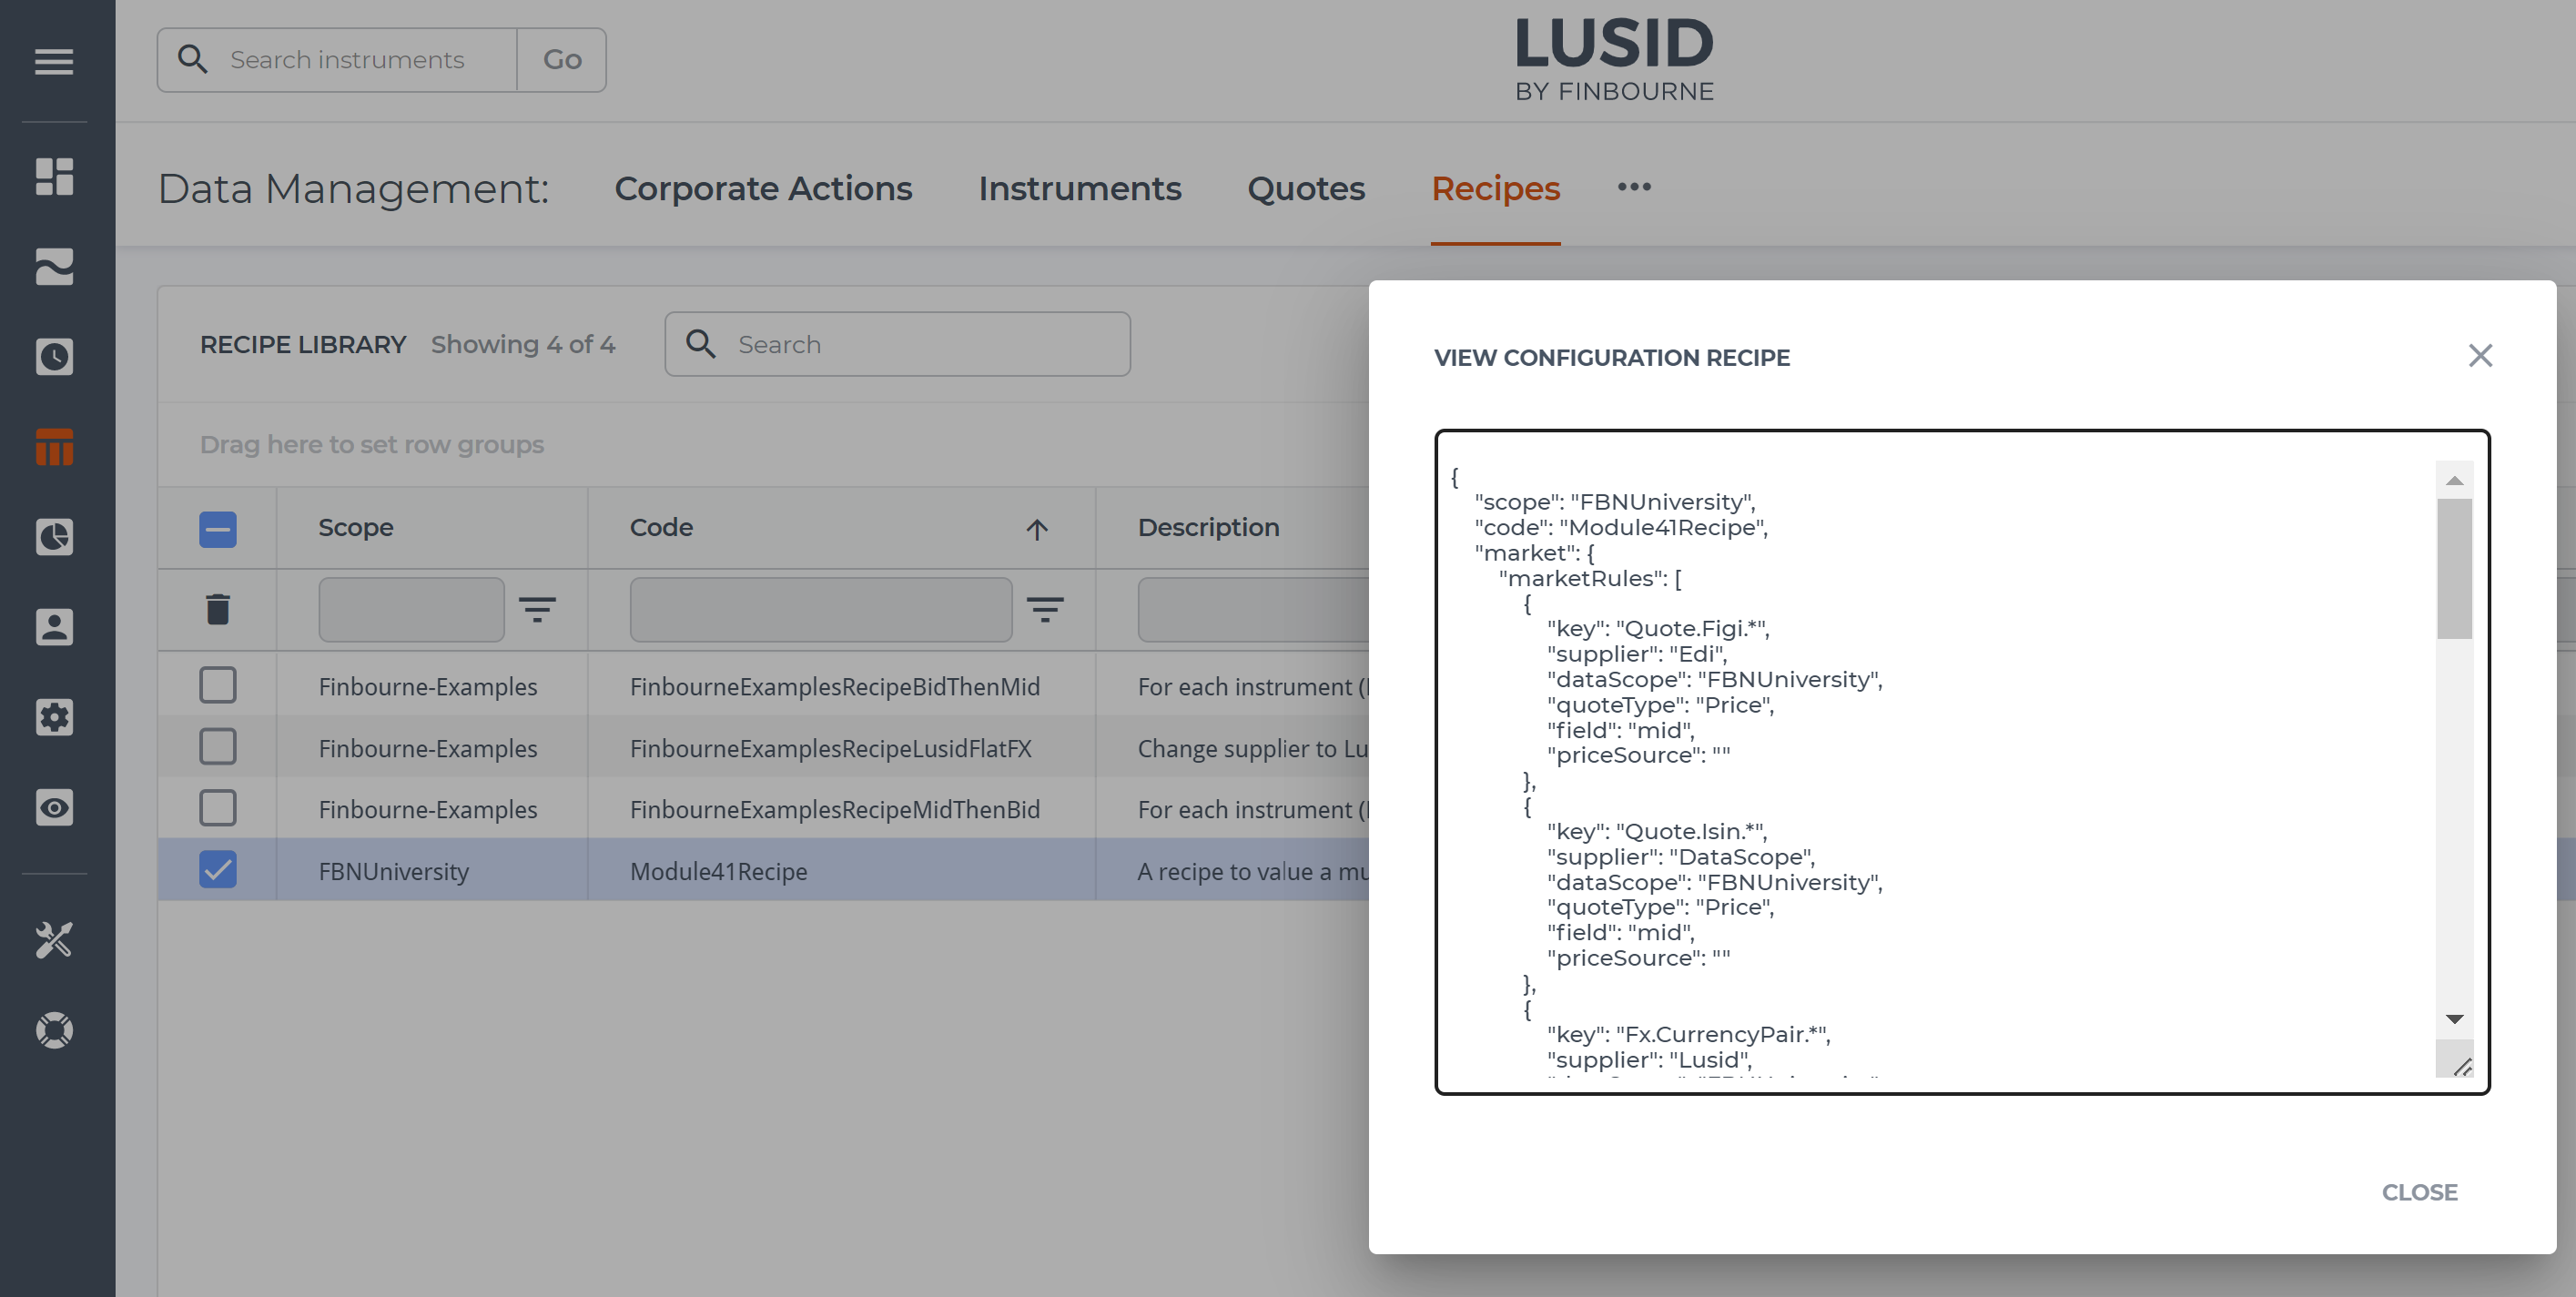
The scope into which market data is loaded in the quote store. In our example, this is
FBNUniversity(see the Scope dropdown in the picture above).The supplier, which must match the provider in the quote store. In our example, this is
Edifor equity prices,DataScopefor bond prices andLusidfor FX rates (see the Provider column in the picture above).Whether the quote is a
Priceor aRate(see the Quote Type column in the picture above).The field, for example
midorbid(this is case sensitive and must match the equivalent quote field exactly; see the Field column in the picture above).An interval determining how long to look back for from the valuation date for valid market data (if more than 24 hours). This must be a dot-separated string nominating a start and end date, for example
5D.0Dto look back 5 days from the valuation date (0 days ago); other mneumonics areW(eek),M(onth) andY(ear). By setting this to2D.0D(two days from the valuation date), we can accommodate our missing FX rate on Thursday 10 March by causing LUSID to automatically fall back to using the rate from Wednesday 9 March.
Changing the default pricing model
For each of the instrument types we want to value (equities and bonds), we need to tell LUSID which built-in pricing model to use. LUSID supports a number of different pricing models, each suited to a particular asset class and set of circumstances. Note that more complex scenarios typically require complex market data such as discount curves, interest curves or volatility surfaces.
The default pricing model model for equities is SimpleStatic, which calculates value for a particular date by multiplying the number of units held on that day by the quote price. However, the default pricing model for bonds is ConstantTimeValueOfMoney, which simply sums future cashflows without taking into account the current market price. For the purpose of this exercise, we'll create a vendor data rule in the recipe that tells LUSID to use SimpleStatic for bonds as well.
Step 6 of the accompanying Jupyter Notebook demonstrates how to create a suitable recipe using the LUSID Python SDK. You can execute the Notebook in Jupyterhub for your LUSID domain and then sign in to the web app to examine the recipe in JSON form on the Data Management > Recipes dashboard (alternatively, the whole recipe, with default options, is printed in the Notebook):
Deciding which metrics to report
LUSID's valuation engine is complex and can report many metrics.
We want to calculate:
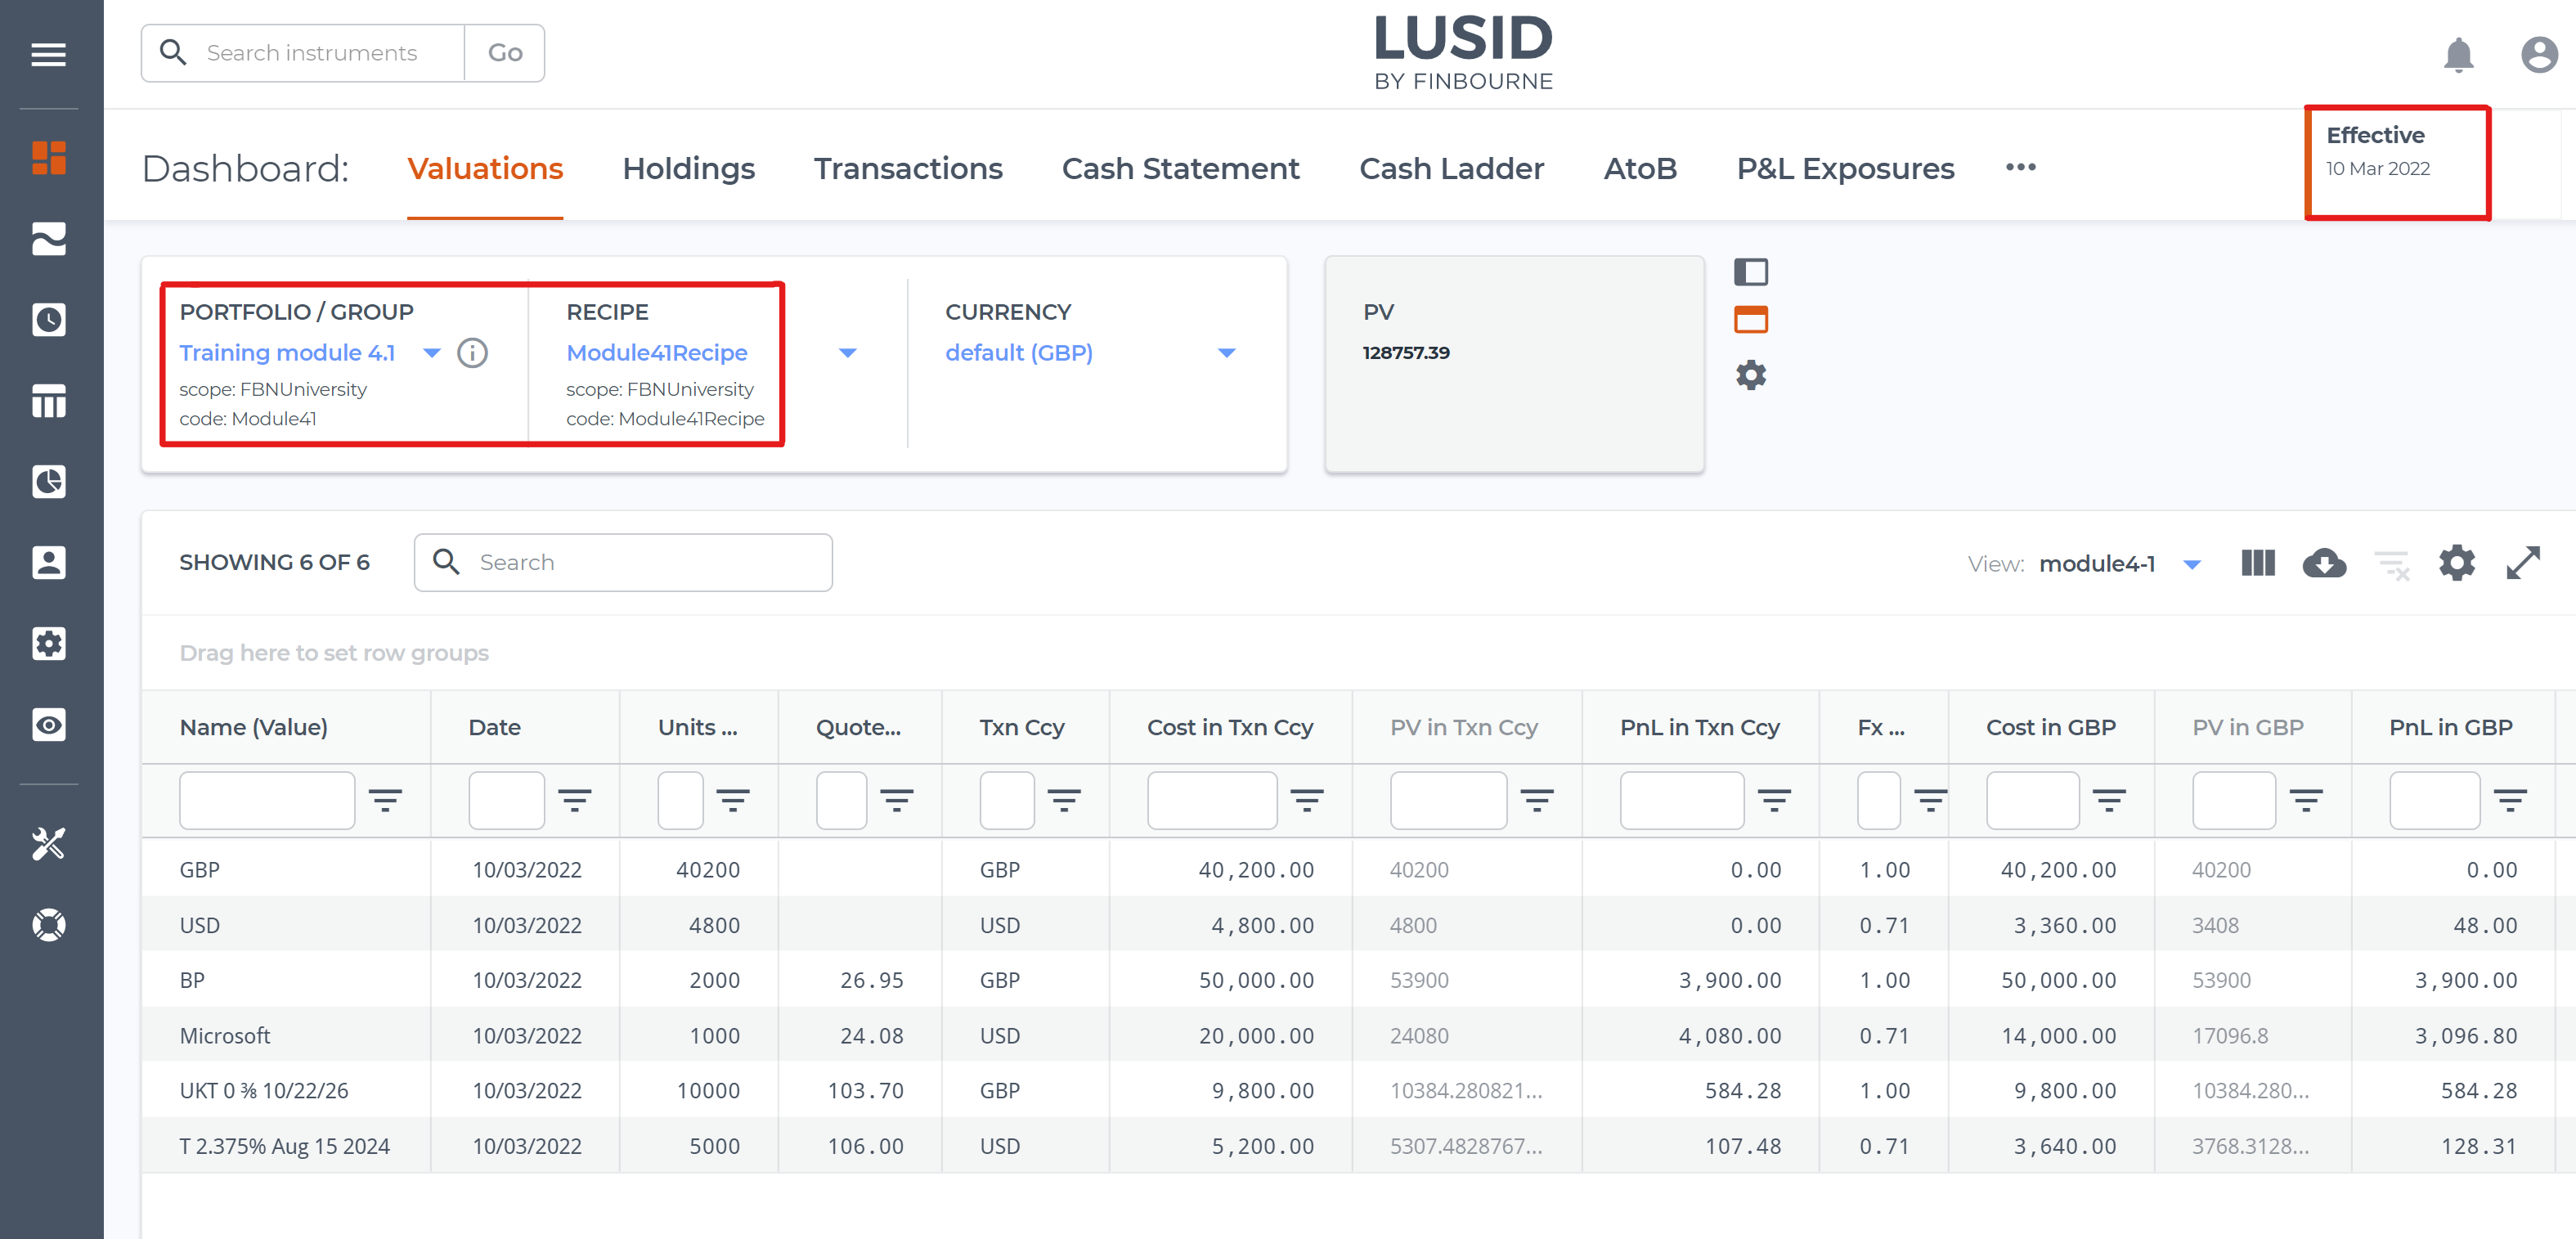
The PV (market value) of each holding in our portfolio in the holding currency each day.
The PV of each USD holding normalised to GBP, the portfolio currency.
The PnL (unrealised gain/loss) for each holding in the holding currency.
The PnL for each holding in GBP, separated into market gain and FX gain.
The PV of the portfolio as a whole each day in GBP.
The PnL for the portfolio as a whole each day in GBP.
We can call the LUSID GetQueryableKeys API to list all the metrics LUSID is able to report. Each metric has an addressable key in the same way as a property, and we can either request the metric Value itself, or ask LUSID to perform a Sum or Proportion operation on a range of metric values.
To create our valuation report, we'll request the following metrics:
Holding/default/Costto calculate cost basis in the holding currency.Holding/Cost/Pfolioto calculate cost basis in GBP, the portfolio currency.Valuation/PVto calculate market value in the holding currency.Valuation/PvInPortfolioCcyto calculate market value in GBP.Valuation/PnL/Unrealisedto calculate unrealised gain/loss in the holding currency (PV minus cost).Valuation/PnL/Unrealised/PfolioCcyto calculate total unrealised gain/loss in GBP. We can further split this by usingValuation/PnL/UnrealisedMarket/PfolioCcyandValuation/PnL/UnrealisedFX/PfolioCcyto calculate how much of the PnL is due to changes to market prices, and how much is due to fluctuating FX rates respectively.
In addition, we'll request other metrics to help us create a meaningful report, such as Instrument/default/Name and Valuation/EffectiveAt.
We're going to value the portfolio in two ways: each holding per day, and the whole portfolio each day. Step 7 of the accompanying Jupyter Notebook demonstrates how to assemble metrics appropriately using the LUSID Python SDK:
To value each holding per day, we'll request each metric
Value(see Step 7.1 in the Notebook).To value the whole portfolio each day, we'll request LUSID to (see Step 7.2 in the Notebook):
Group by
Valuation/EffectiveAtin order to create one entry for the portfolio each day rather than the default of one entry per holding.Sumcertain metrics to calculate totals for the portfolio each day, notablyHolding/Cost/Pfolio,Valuation/PvInPortfolioCcyandValuation/PnL/Unrealised/PfolioCcy. Note it doesn't make sense to sum string metrics such asInstrument/default/Name, nor numeric metrics such asValuation/PVwhere values might be in different currencies.
Valuing the portfolio
We can now call the LUSID GetValuation API, passing in an appropriate valuation request.
Valuing each holding per day
Step 7.1 of the accompanying Jupyter Notebook demonstrates how to pass in a valuation request using the LUSID Python SDK that:
Identifies the portfolio to value and the recipe to use.
Specifies the metrics to report and requests LUSID return a
Valuefor each.Declares a schedule encompassing our dates of Monday 7 March to Friday 11 March inclusive, sorted in date order.
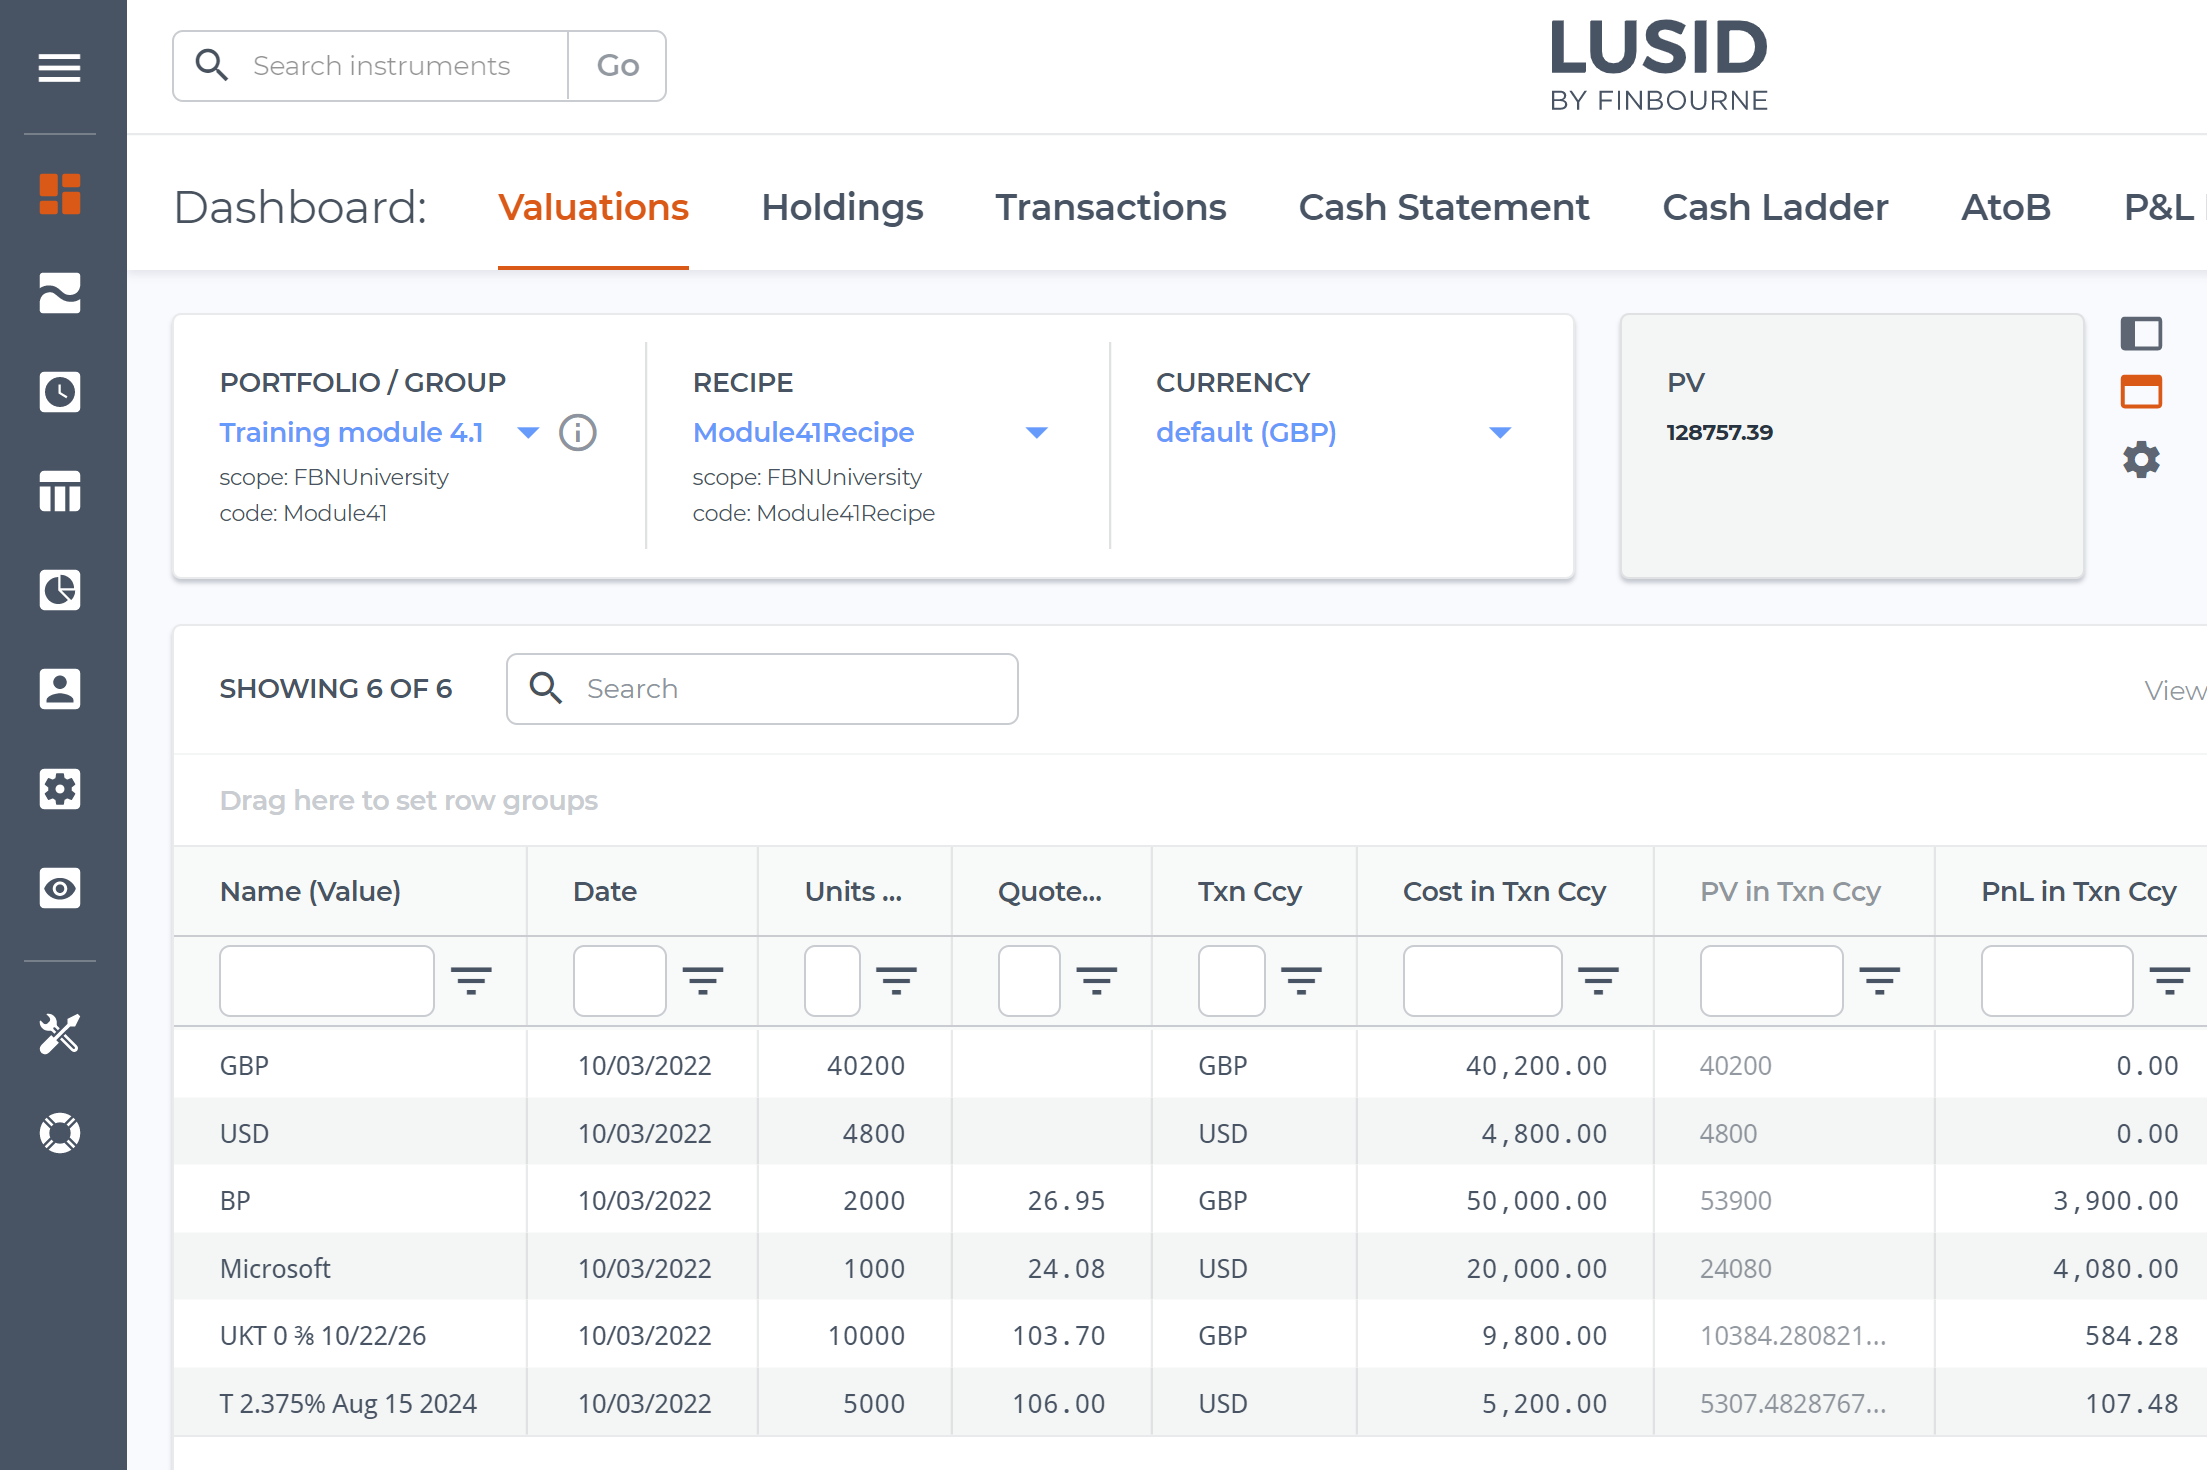
You can execute the Notebook in Jupyterhub for your LUSID domain and then sign in to the web app to examine the Data Management > Valuation dashboard. Choose the portfolio and recipe (highlighted top left) and a particular day using the Effective datetime picker (highlighted top right).
For example, if we look at Thursday 10 March and examine the Fx column we can see that LUSID has automatically fallen back to using the USD/GBP rate for Wednesday 9 March (which was 0.71):
Valuing the portfolio as a whole each day, and tracking performance over the week
Step 7.2 of the accompanying Jupyter Notebook demonstrates how to pass in a valuation request that:
Identifies the portfolio to value and the recipe to use.
Specifies the metrics to report and requests LUSID
Suma range of metric values.Groups by valuation date to request LUSID sum holdings and calculate a total for the portfolio each day.
Declares a schedule encompassing our dates of Monday 7 March to Friday 11 March inclusive, sorted in date order.
You can execute the Notebook in Jupyterhub for your LUSID domain, but unfortunately it's not possible to see a valuation for a range of dates in the LUSID web app at the current time. This picture is taken from the Notebook output:
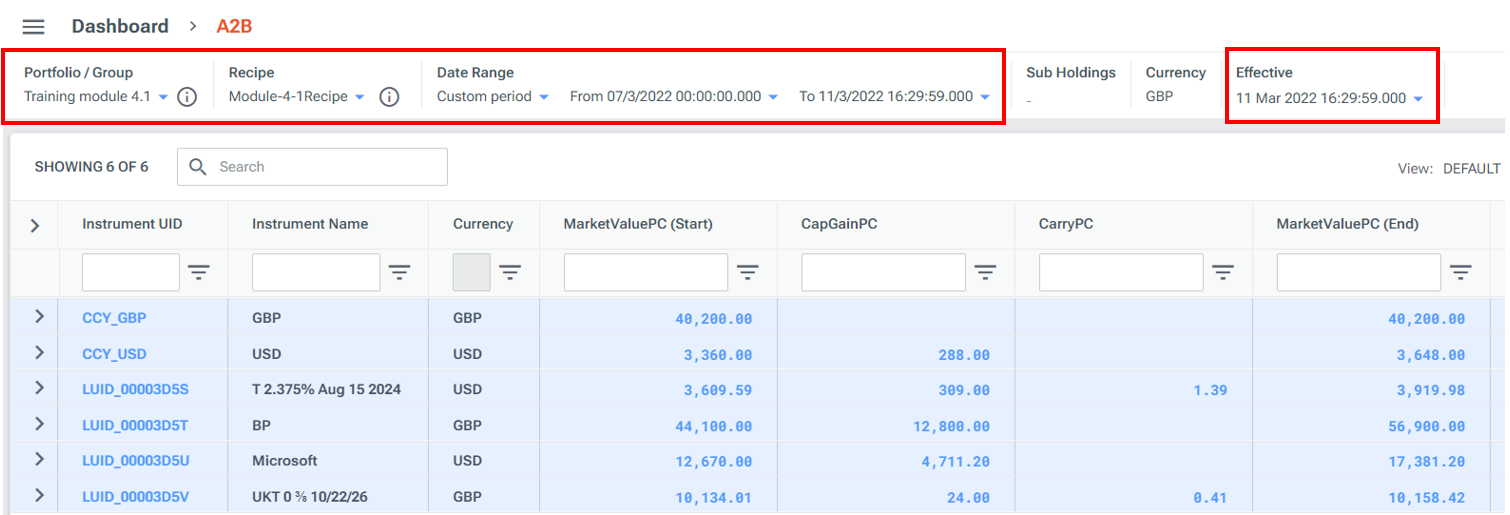
Creating an A2B report
We can generate an A2B report using the same market data and recipe to understand precisely how the portfolio has changed in value between Monday 7 March and Friday 11 March 2022.
For each holding in a portfolio, an A2B report performs the following calculation in both the holding and portfolio currencies:
(Start Value + Flows + Gains + Carry) = End Value
where:
Start Valueis the market value of the holding at the start of the window. This can be zero if, for example, you first transact in the underlying instrument during the window.Flowsare transactions that result in increases or decreases in the quantity of the holding.Gainsare capital gains or losses caused by market price or exchange rate fluctuations.Carryis income (for example, dividend or accrual) or expense (for example, management or transaction fee) activity.End Valueis the market value of the holding at the end of the window.
Step 8.1 of the accompanying Jupyter Notebook demonstrates how to create an A2B report. You can execute the Notebook in Jupyterhub for your LUSID domain and then sign in to the web app to examine the Data Management > A2B dashboard. Choose the portfolio, recipe and a date range (highlighted top left). Then choose the end day using the Effective datetime picker (highlighted top right), in our case Friday 11 March:
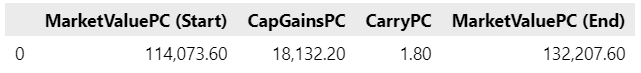
Unfortunately, it's not yet possible to see aggregated column totals in the LUSID web app at this time. Step 8.2 of the accompanying Jupyter Notebook demonstrates how to calculate column totals using the Pandas sum() function (note it only makes sense to sum columns normalised to the portfolio currency). This picture is taken from the Notebook output:
Summary
In this tutorial, we've seen how to:
Set up bond instrument definitions and load bond quotes in a way that enables LUSID to value them correctly.
Maintain the cost basis in the portfolio currency by normalising foreign currency transactions.
Match a valuation recipe to quote definitions in order that the former can retrieve the latter at valuation time.
Return common BI metrics such as PV and PnL on a per holding and per portfolio basis.
Create an A2B report to understand how the valuation has changed over time.