The quickest and most intuitive way to apply a scenario is to use the LUSID web app to shift PV in portfolio currency for every portfolio holding and show before (base) and after (shifted) values side-by-side.
Alternatively you can shift individual metrics from a supported set, or every metric in the entire valuation.
Note the following:
Applying a scenario never changes your stored market data. LUSID shifts the market data it has located in memory only.
LUSID uses the version of the scenario that was current at the valuation’s as-at time, so you can reproduce past results.
A shift that matches nothing in your portfolio doesn’t cause an error: the holdings it would have affected simply keep their base values. If a result looks unchanged, preview the scenario to check what it affects.
Stress testing PV in portfolio currency using the web app
Navigate to Portfolio Management > Valuations and choose a portfolio, a recipe and an effective date in the usual way. Then, from the Scenarios picker, choose one or more scenarios:
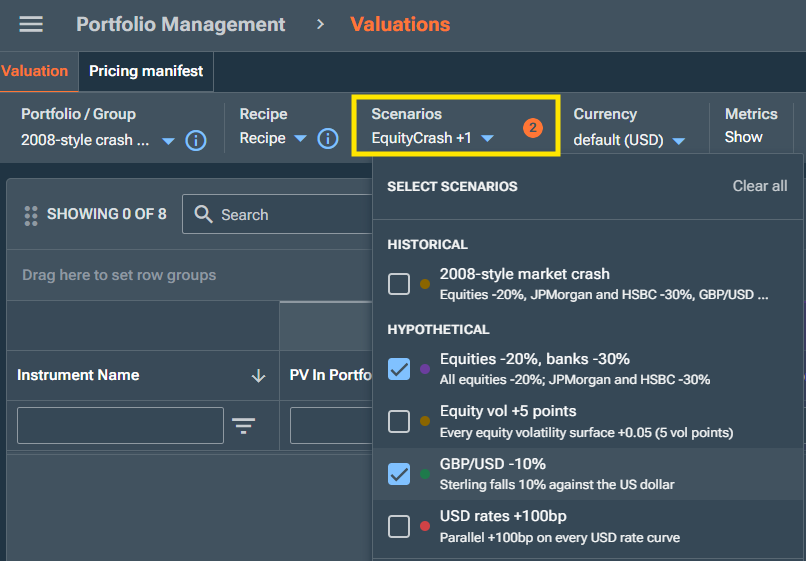
LUSID adds a Base · Latest column group showing current PV and, for each scenario, a colour-coded column group to the right showing PV shifted. Each group holds two columns:
PV in portfolio currency for each holding (the
Valuation/PvInPortfolioCcymetric with theDefaultSumoperation)That PV as a proportion of the portfolio total (the
Valuation/PvInPortfolioCcymetric with theProportionoperation):
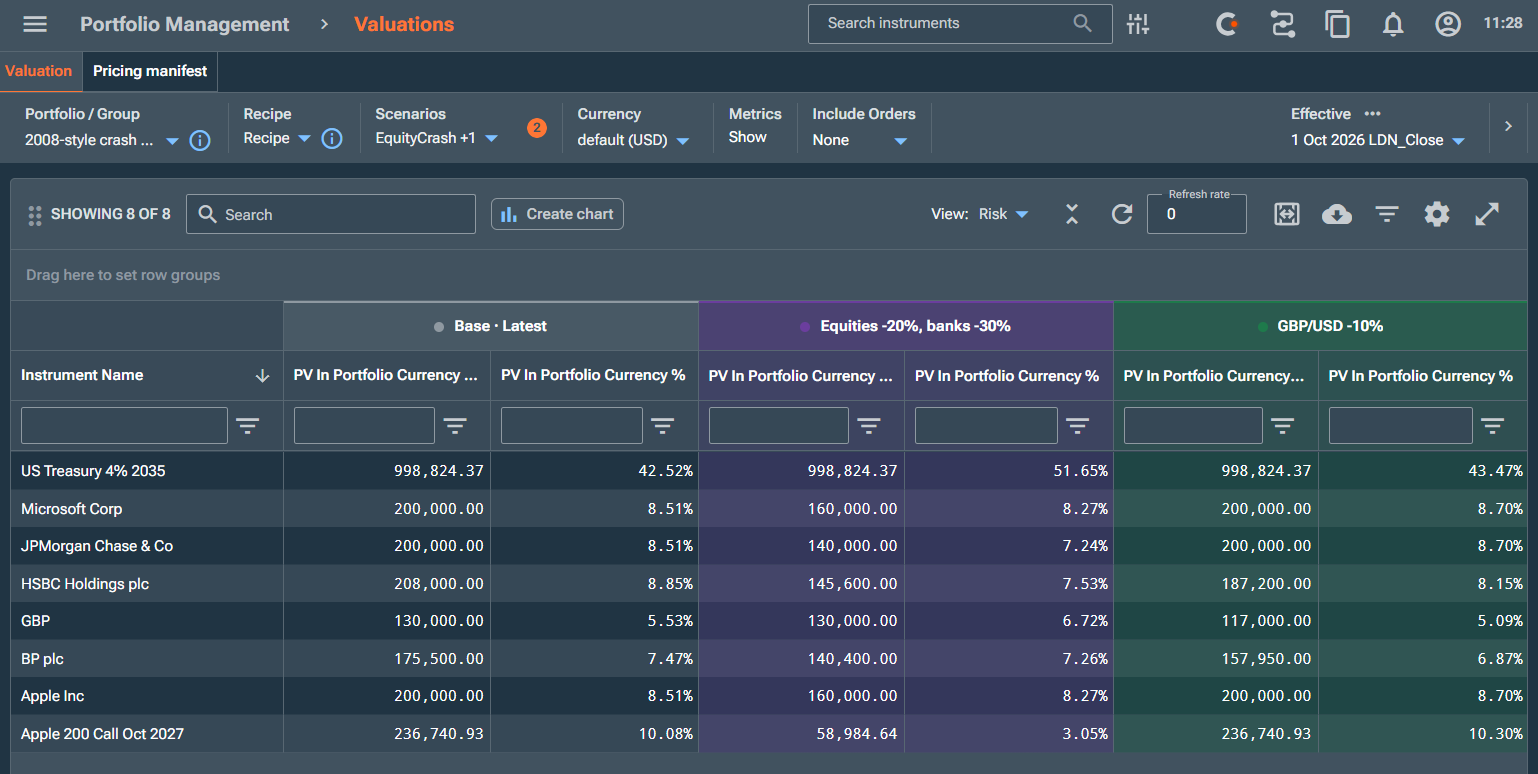
Note the following:
the LUSID web app chooses to shift PV in portfolio currency because it reflects every kind of shift, including FX, and it’s in one currency, so you can add it up across the portfolio. For example, under a scenario where HSBC shares fall 30% and GBP/USD falls 10%, a USD portfolio’s HSBC holding falls 37% in portfolio currency, but only 30% in its own currency, GBP. These metrics are not configurable.
Every other metric, such as PV in holding currency or accrued interest, keeps its base value. See how to shift individual metrics.
Each scenario always gets the same colour, for every user. Groups appear in the order you chose them. The web app remembers your choice of scenarios for each dashboard.
If your view includes risk metrics, some holdings may not be able to produce them. For example, equities valued from a price have no curve to bump. To stop one such holding failing the whole report, set the
allowPartiallySuccessfulEvaluationrecipe pricing option; the affected cells are then blank.
Stress testing individual metrics using the web app or API
You can see most PV and analytic metrics under a scenario, not just PV in portfolio currency, but you must apply the scenario explicitly to each metric.
Right-click the header of the column you want to shift (such as Yield To Maturity) and select Options · Scenario:
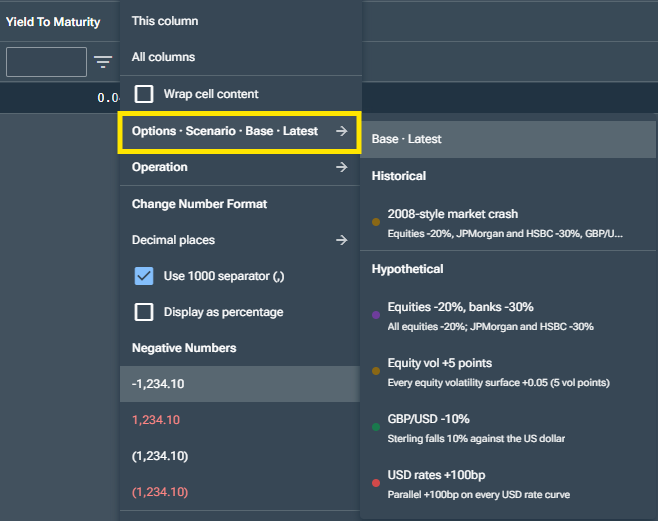
Choose a scenario. LUSID adds a copy of the column to its right, tinted in the scenario’s colour and labeled with the column name and scenario short code:
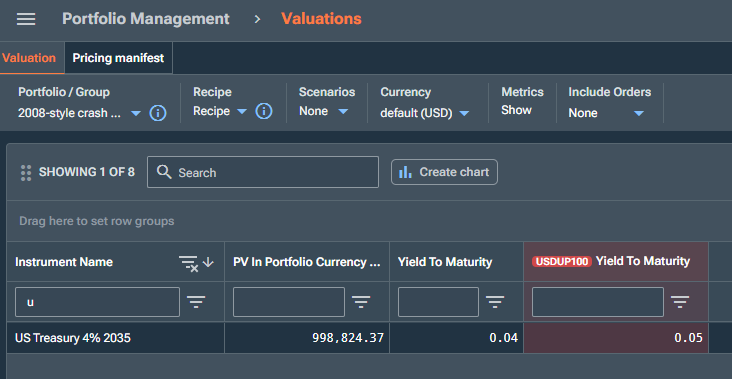
To change the scenario on a copy, right-click it and choose another one. To remove the copy, choose Base · Latest. You can also add a scenario version of a metric when you add the column: in Add columns, select Options next to the metric and choose a Scenario.
Note the following:
You can only do this for metrics that support scenarios (see below). For other columns, the menu doesn’t offer Scenario.
You can add one scenario per copy, but as many copies as you like.
LUSID adds a scenario version of the metric next to the normal one, so you can compare them.
You can’t add a scenario to the columns inside the groups created by the Scenarios picker. If a scenario is already applied through the picker, you can’t also choose it for the PV in portfolio currency column.
Call the GetValuation API and add ScenarioScope and ScenarioCode options to supported metrics.
Consider the following example, which returns PV in holding currency, PV in portfolio currency and modified duration, each with and without the MarketCrash scenario for comparison purposes:
curl -X POST 'https://<your-domain>.lusid.com/api/api/aggregation/$valuation'
  -H 'Authorization: Bearer <your-API-access-token>'
  -H 'Content-Type: application/json-patch+json'
  -d '{
  "portfolioEntityIds": [{"scope": "ScenarioTutorial", "code": "CRASH-USD", "portfolioEntityType": "SinglePortfolio"}],
  "recipeId": {"scope": "ScenarioTutorial", "code": "Recipe"},
  "valuationSchedule": {"effectiveAt": "2026-10-01T00:00:00Z"},
  "metrics": [
    {"key": "Instrument/default/Name", "op": "Value"},
    {"key": "Valuation/PV", "op": "Value"},
    {"key": "Valuation/PV", "op": "Value", "options": {"ScenarioScope": "ScenarioTutorial", "ScenarioCode": "MarketCrash"}, "returnAs": "PV_Crash"},
    {"key": "Valuation/PvInPortfolioCcy", "op": "Value"},
    {"key": "Valuation/PvInPortfolioCcy", "op": "Value", "options": {"ScenarioScope": "ScenarioTutorial", "ScenarioCode": "MarketCrash"}, "returnAs": "PvPortfolioCcy_Crash"},
    {"key": "Analytic/ModifiedDuration", "op": "Value"},
    {"key": "Analytic/ModifiedDuration", "op": "Value", "options": {"ScenarioScope": "ScenarioTutorial", "ScenarioCode": "MarketCrash"}, "returnAs": "ModDur_Crash"}
  ]
}'
Note the following:
You can add different scenarios to different metrics, or several scenarios to the same metric, in one request.
Use
returnAsto give a scenario column a friendly name. The name must start with a letter and contain only letters, numbers, underscores and hyphens. If you omit it, LUSID names the column after the metric and its options, for exampleValuation/PvInPortfolioCcy(ScenarioScope="ScenarioTutorial", ScenarioCode="MarketCrash").Operations work on scenario columns too. For example,
"op": "Proportion"returns each holding’s share of the portfolio total under the scenario.The response includes a
scenarioDiagnosticssection listing each piece of market data the scenarios shifted.If you add scenario options to a metric that doesn’t support them (such as a risk metric), LUSID rejects the request.
Individual metrics you can stress-test
Most analytic metrics apply to bonds and other fixed-income instruments. For holdings a metric doesn’t apply to, the cell is blank under the scenario, as it is in the base column.
Category | Metrics |
|---|---|
PV |
|
Duration and convexity |
|
Yields |
|
Spreads and margins |
|
Credit sensitivity |
|
Other analytics |
|
Stress testing the entire valuation using the API
You can apply a single scenario to the entire valuation (that is, recalculate every metric, including risk metrics), using the API. Note you cannot perform this operation using the web app.
To do this, specify a scenario scope and code in your GetValuation API request:
curl -X POST 'https://<your-domain>.lusid.com/api/api/aggregation/$valuation'
  -H 'Authorization: Bearer <your-API-access-token>'
  -H 'Content-Type: application/json-patch+json'
  -d '{
  "portfolioEntityIds": [{"scope": "ScenarioTutorial", "code": "CRASH-USD", "portfolioEntityType": "SinglePortfolio"}],
  "recipeId": {"scope": "ScenarioTutorial", "code": "Recipe"},
  "valuationSchedule": {"effectiveAt": "2026-10-01T00:00:00Z"},
  "scenario": {"scope": "ScenarioTutorial", "code": "MarketCrash"},
  "metrics": [
    {"key": "Instrument/default/Name", "op": "Value"},
    {"key": "Valuation/PvInPortfolioCcy", "op": "Value"},
    {"key": "Risk/Rates/Pv01", "op": "Value"}
  ]
}'
Note the following:
The response contains no base values. To compare, run the same request again without
scenario.You can only apply a single scenario this way, and you can’t also add scenario options to individual metrics in the same request.
You can’t use a scenario that contains a market data rule shift, or a rate curve shift with
applyTo.To value against a particular version of the scenario, add an
asAtto the scenario’s scope and code. Otherwise LUSID uses the version current at the request’s as-at time.
Stress testing risk metrics
Risk metrics measure sensitivity: how much a holding’s value would change if a risk factor moved by a small amount. For example, Risk/Rates/Pv01 reports the change in value for a 1bp rise in rates. LUSID calculates it by nudging the curve and revaluing.
When you stress test the entire valuation, LUSID first moves the market by the scenario, and then calculates the risk metric on top of the shifted market. The result is your sensitivity in the stressed world: how exposed you’d be after the scenario has happened.
For example, consider a portfolio where a US Treasury’s Risk/Rates/Pv01 is −733.61 USD today. Under a scenario that raises USD rates by 100bp, it’s −676.61 USD. The bond is less sensitive to a further rise once rates are higher, so a hedge sized for today would be too large after the shock.
Note the following:
This is the only way to shift a risk metric. You can’t add scenario options to a risk metric, and the web app doesn’t offer it.
Risk metrics are only available for holdings whose pricing model depends on market data LUSID can bump. Holdings valued from a looked-up price, such as equities under
SimpleStatic, can’t produce risk, and fail the entire request unless your recipe allows partial success.
Reverse stress testing using the API
A reverse stress test works backwards from an outcome. Instead of asking what a scenario does to your portfolio, you ask how severe the scenario would have to be to cause a particular loss or gain. For example: how much worse than MarketCrash would markets have to get for a portfolio to lose 1,000,000 USD?
LUSID multiplies every shift in the scenario by the same factor, or scale, and searches for the scale that produces your target change in value. A scale of 1 is the scenario as written. A scale of 2 doubles every shift, so a 20% fall becomes a 40% fall and a 100bp rise becomes 200bp. A scale of 0.5 halves every shift.
To do this, call the SolveReverseStress API with a portfolio, a recipe, an effective date, a scenario and a target change in value:
curl -X POST 'https://<your-domain>.lusid.com/api/api/scenarios/$reversestress'
  -H 'Authorization: Bearer <your-API-access-token>'
  -H 'Content-Type: application/json-patch+json'
  -d '{
  "portfolioEntityIds": [{"scope": "ScenarioTutorial", "code": "CRASH-USD", "portfolioEntityType": "SinglePortfolio"}],
  "recipeId": {"scope": "ScenarioTutorial", "code": "Recipe"},
  "effectiveAt": "2026-10-01T00:00:00Z",
  "scenario": {"scope": "ScenarioTutorial", "code": "MarketCrash"},
  "targetPnl": -1000000,
  "metric": "Valuation/PvInPortfolioCcy",
  "maxScale": 3
}'
The request takes the following fields, in addition to the portfolio, recipe, effective date and scenario:
Field | Description | Default |
|---|---|---|
| Required. The change in value to solve for, in the currency of the metric. Use a negative number for a loss and a positive number for a gain. It can’t be zero. | None |
| The value LUSID adds up across the portfolio. Use a PV metric such as |
|
| The currency for | None |
| The largest scale LUSID tries. | 5 |
| The number of evenly spaced scales between zero and | 5 |
| How close the result must be to the target, as a fraction of the target. The default of 0.0001 means within 0.01%, or 100 USD on a 1,000,000 USD target. | 0.0001 |
| The number of extra valuations LUSID performs after valuing the ladder. | 3 |
| Optional. These work as they do in a GetValuation request. | None |
Consider the following example response (rounded to two decimal places):
{
  "scale": 2.3336,
  "targetPnl": -1000000.0,
  "achievedPnl": -1000053.99,
  "baseValue": 2349065.29,
  "stressedValue": 1349011.30,
  "converged": true,
  "method": "Interpolation",
  "valuations": 3,
  "ladder": [
    {"scale": 0.6,    "value": 2037485.74, "pnl": -311579.55},
    {"scale": 1.2,    "value": 1768447.02, "pnl": -580618.28},
    {"scale": 1.8,    "value": 1534170.90, "pnl": -814894.39},
    {"scale": 2.3336, "value": 1349011.30, "pnl": -1000053.99},
    {"scale": 2.3367, "value": 1347979.07, "pnl": -1001086.22},
    {"scale": 2.4,    "value": 1327244.02, "pnl": -1021821.27},
    {"scale": 3.0,    "value": 1141066.01, "pnl": -1207999.28}
  ],
  "warnings": []
}
Note the following:
scaleis the answer. Here,MarketCrashwould have to be about 2.33 times as severe for the portfolio to lose 1,000,000 USD. That means equities falling 46.7% instead of 20%, the banks 70% instead of 30%, GBP/USD 23.3% instead of 10%, USD rates rising 233bp instead of 100bp, and equity volatility rising by 0.117 instead of 0.05. Every shift scales, including volatility and rate shifts.achievedPnlis the change in value at that scale, and it’s within the tolerance of your target.stressedValueisbaseValueplusachievedPnl.convergedistruewhen LUSID has met the tolerance.ladderlists every scale LUSID valued, in the order of scale, with the portfolio value and change in value at each one. It shows how your loss grows as the scenario gets more severe. LUSID adds extra points near the answer as it homes in.For a more precise answer, raise
ladderPointsand lowertolerance. With 12 ladder points and a tolerance of 0.000001, the example solves to a scale of 2.33343 and a loss of 1,000,000.02 USD.
Choosing the metric and maximum scale
Two settings need care:
Use a PV metric in a single currency if your portfolio holds instruments in more than one currency. The default metric,
Valuation/PV, is in each holding’s own currency, which LUSID can’t add up, so it rejects the request. SetmetrictoValuation/PvInPortfolioCcy, or toValuation/PvInReportCcywith areportCurrency.Choose a
maxScalethat keeps your largest shift realistic. LUSID values the portfolio at every ladder point up tomaxScale. If any holding can’t be priced at one of them, the whole request fails. For example, at the defaultmaxScaleof 5,MarketCrashwould make bank shares fall 150%, at which point the request fails. AmaxScaleof 3 limits the fall to 90%.
When LUSID can’t find an answer
If no scale between zero and maxScale reaches your target, LUSID still returns the ladder, but scale is empty, converged is false and warnings explains why. This happens when:
The target is too large. For example,
MarketCrashloses at most about 1,208,000 USD at a scale of 3, so a 2,000,000 USD target is out of reach. RaisemaxScaleif a more severe scenario is still realistic.The scenario moves the portfolio the wrong way. For example,
MarketCrashcan’t produce a gain at any scale, so a positive target fails. Check the sign oftargetPnl, and preview the scenario to check what it affects.
LUSID rejects the request outright if:
targetPnlis zero.metricis a risk metric.The scenario contains a model option shift or a market data rule shift. These change how LUSID prices or finds market data rather than moving the market by an amount, so there’s nothing to scale.