This tour shows LumiCode's main features, one screen at a time: writing SQL, exploring and charting results, working with Candela, browsing the catalog, searching your history and diagnosing failed queries. To try LumiCode yourself step by step, start with Getting started with LumiCode.
Navigating your options
Every command, as well as the SQL editor, supports command completion.
So seeing a list of commands is as simple as typing / + Tab.
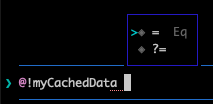
For example typing /help + Tab gives you this: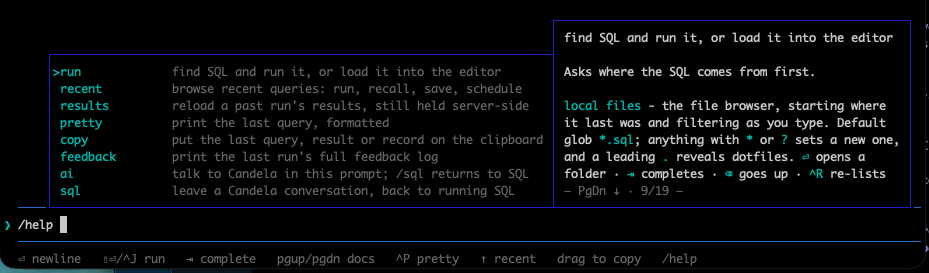
Writing SQL
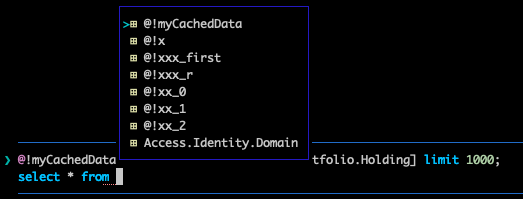
Writing SQL works the way you'd expect: just start typing, press Tab if you are stuck and code completion will help you finish writing it or ask Candela to help out. You will see functions, providers, their fields and parameters, and code completion shows the documentation for each.
You can run more than one SQL statement at a time by putting a \ on its own line between them.
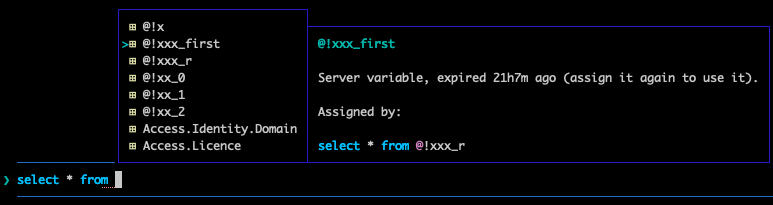
Links to reference documentation are likewise available:
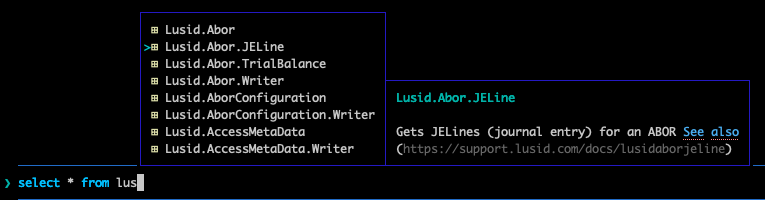
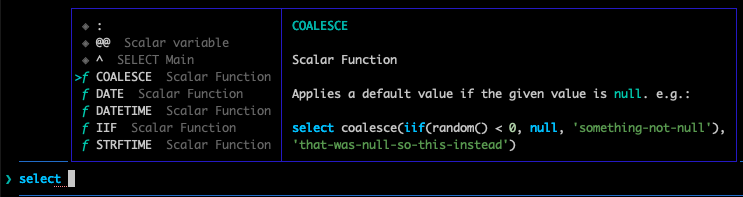
You can always see what sort of SQL can follow beyond where your cursor lies ("code completion").
LumiCode shows progress as your query runs: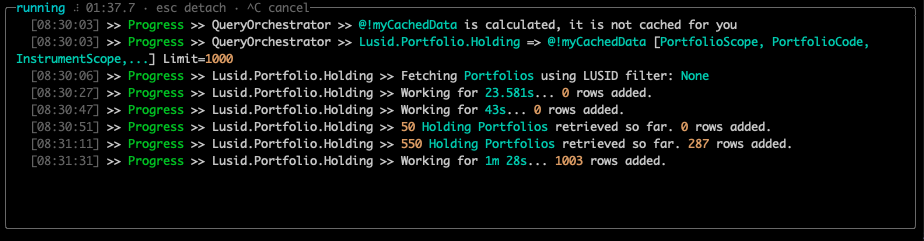
And you can get the full log into the transcript with /feedback.
Multi-queries
A multi-query is a set of named queries that you write in the editor, where each query can read the results of the ones above it. LumiCode runs independent queries at the same time, and you can save the whole set, and all its results, in one go.
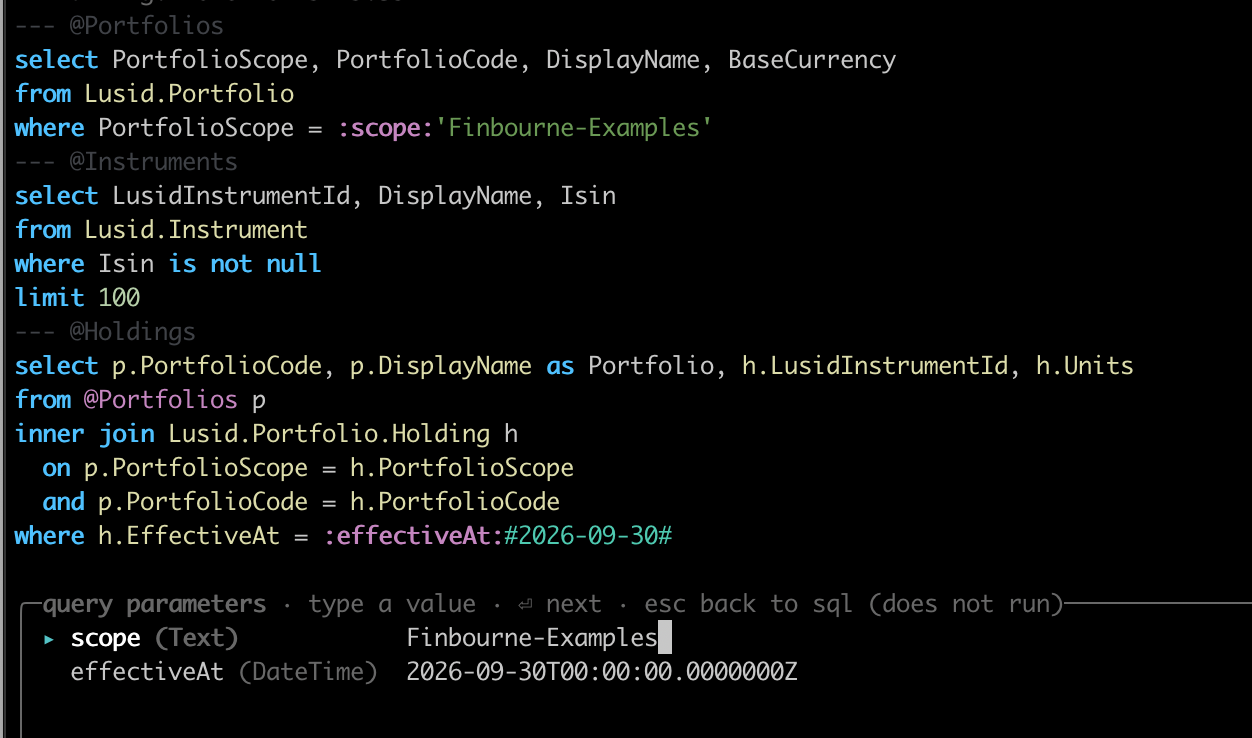
To write and run one, see How do I run several queries together as a multi-query?
Data rendered in tables, grouped tables and charts
LumiCode writes a summary of the results to the transcript: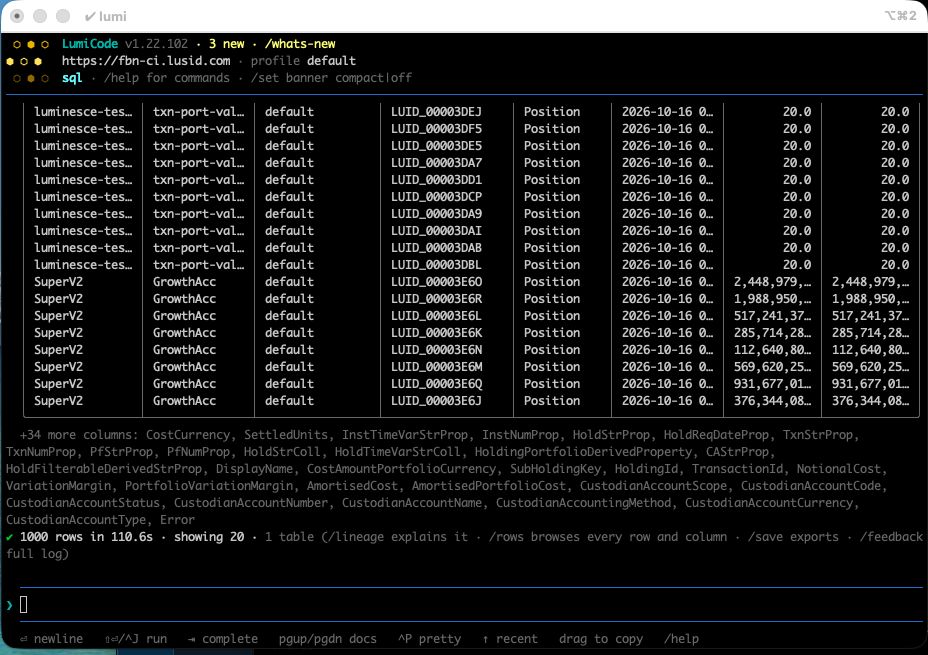
Wherever you see data, if a provider (or a view you create!) supports links, LumiCode adds links that open other websites. This could open into LUSID, showing dialogs (Drive, LUSID-Instruments, Scheduler logs, Configuration Service entries, etc.) or any other site, such as Google Maps or your own internal systems.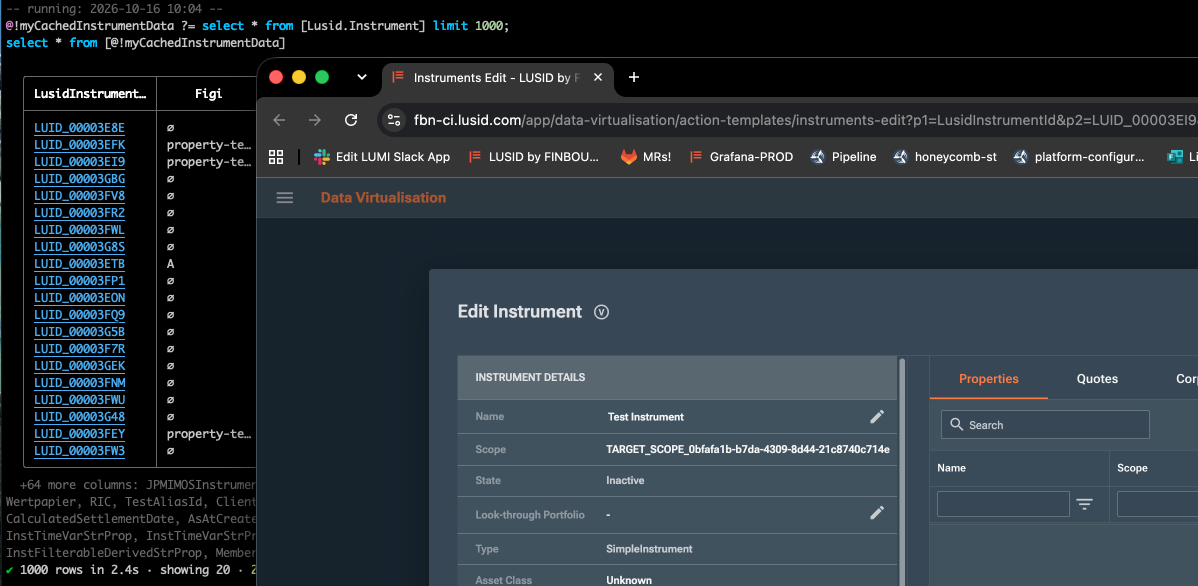
/rows
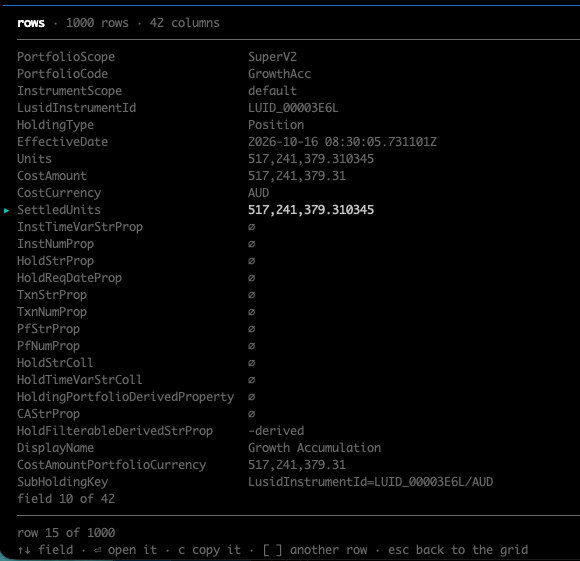
/rows lets you explore all rows, further filter, choose columns, sort, and show detail cards (a panel showing every field of one row).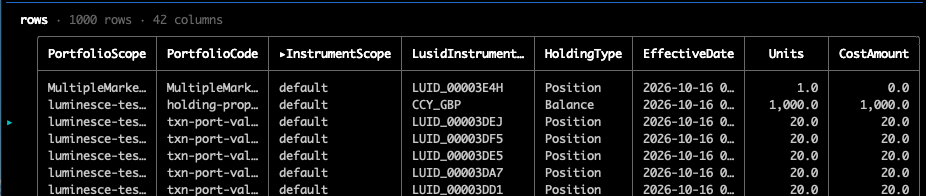
/group
Lets you group by any number of columns, expand them, apply group-aggregations, etc.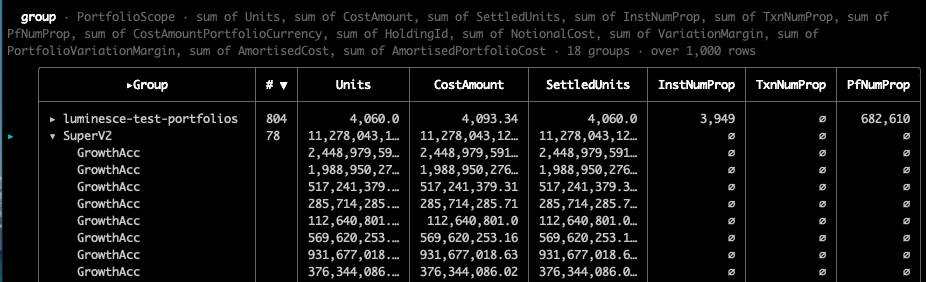
/chart
You can render the data as many types of chart, including into the transcript: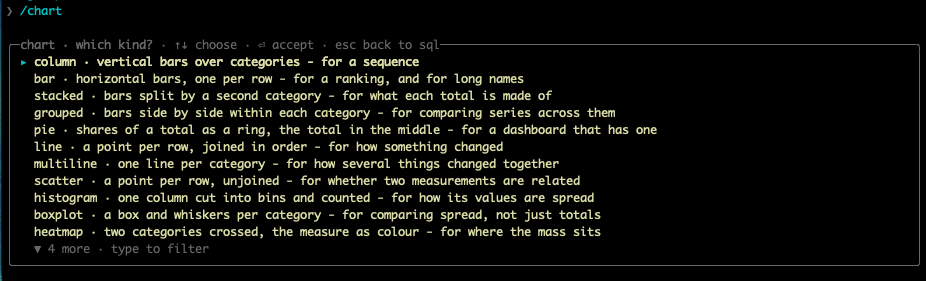
/chart gallery will show you examples of the full set, here's a small sample: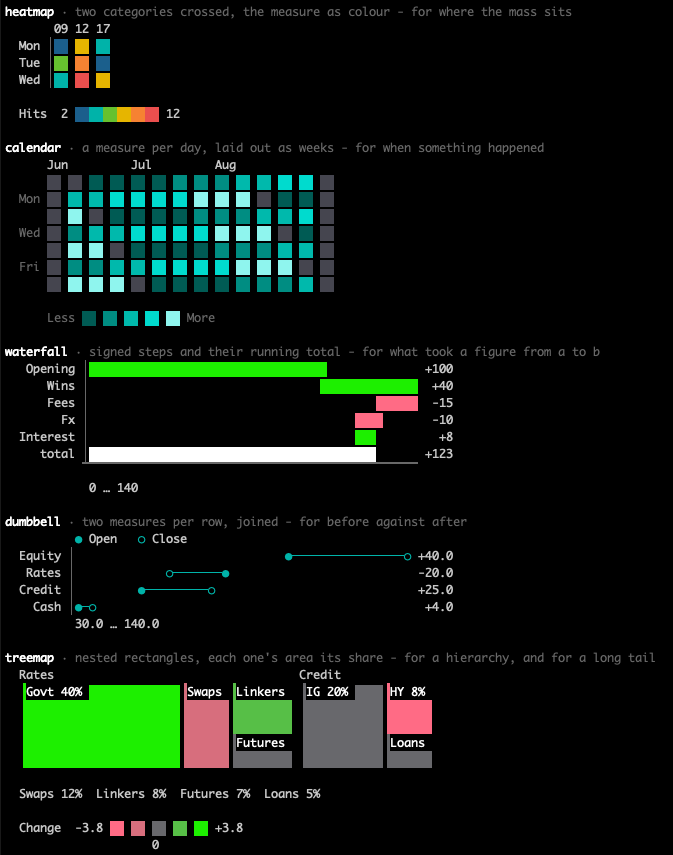
Using the built-in Candela AI
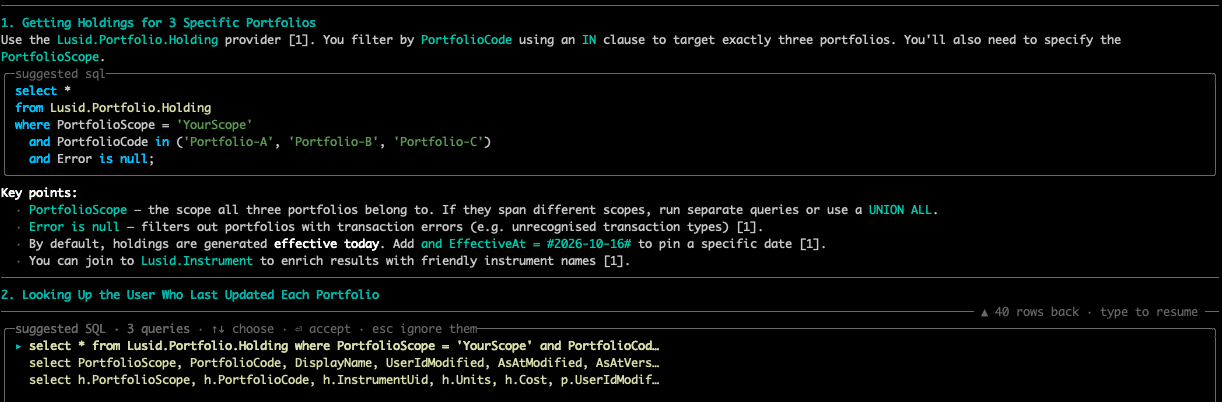
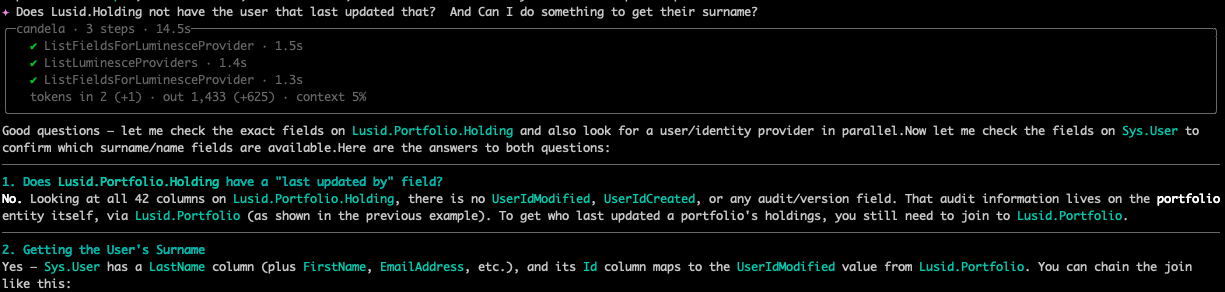
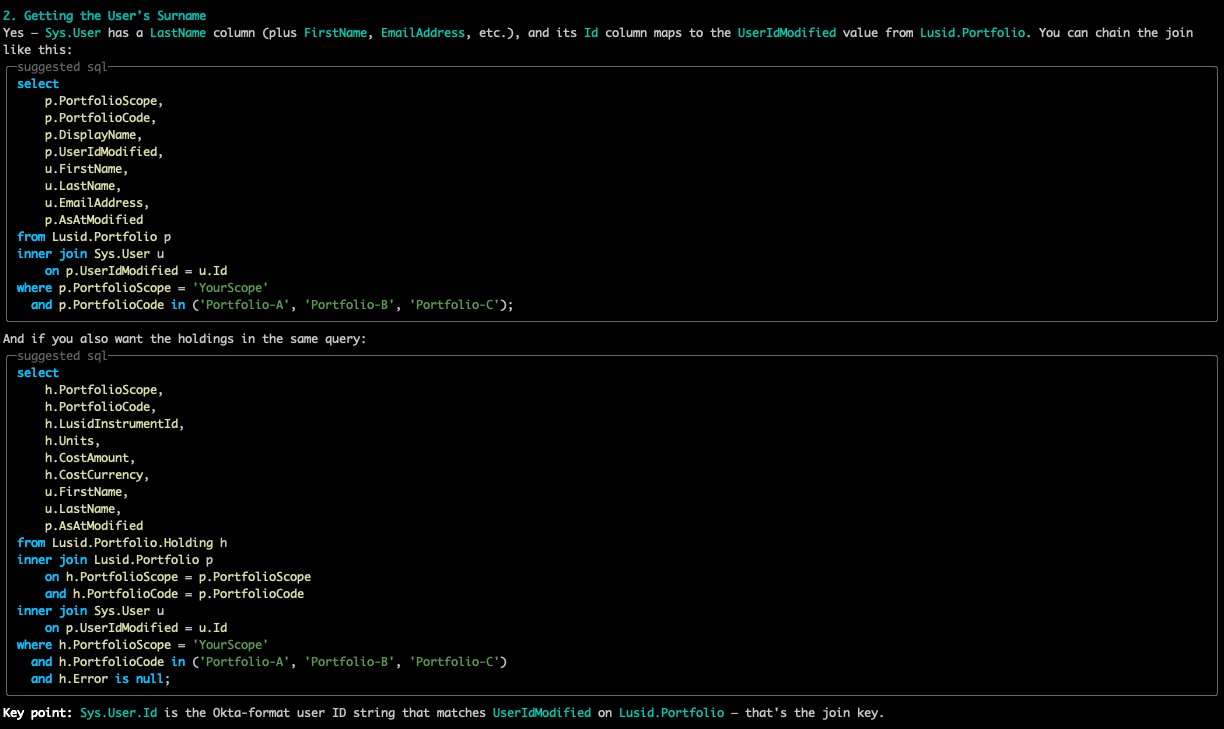
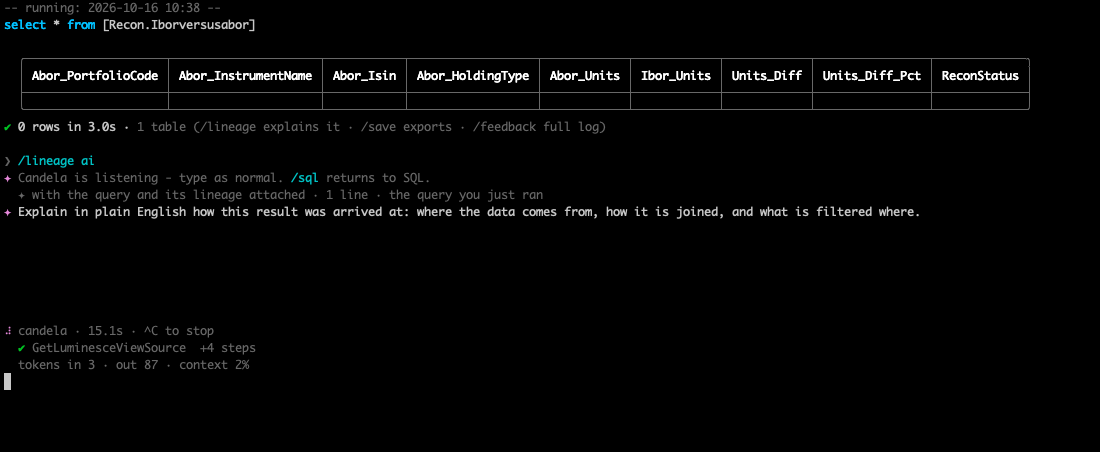
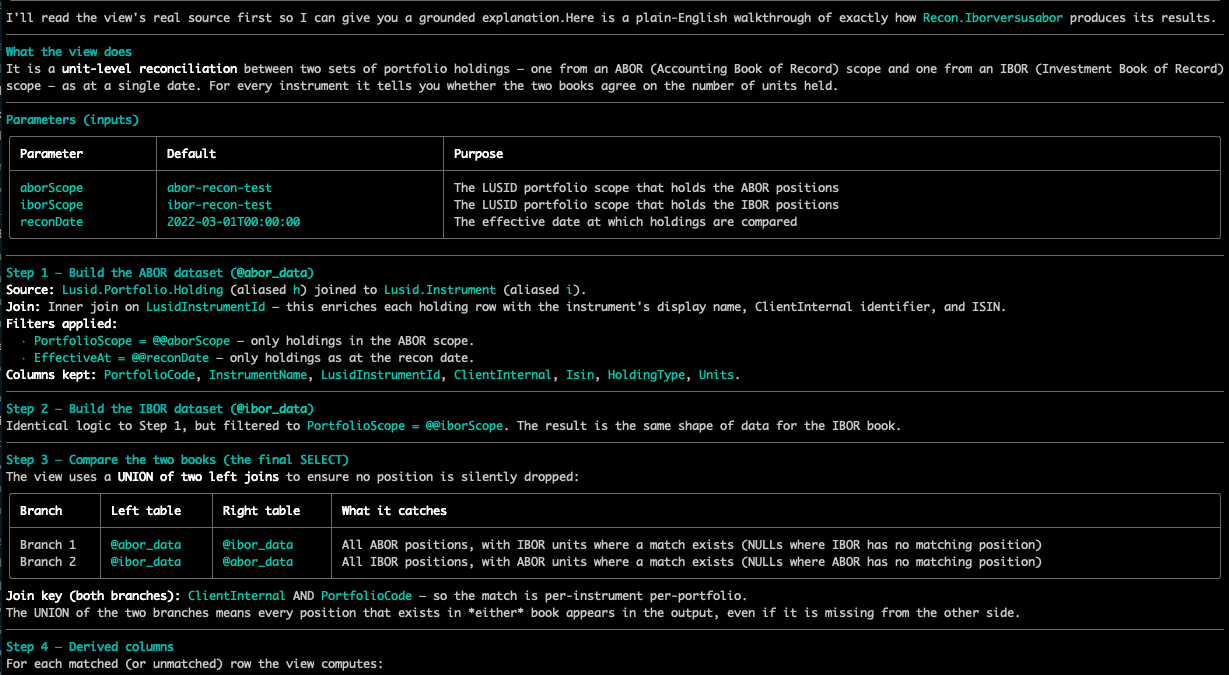
LumiCode natively uses Candela, FINBOURNE's AI agent. You can use it to ask about providers in your catalog, optimise queries, explain lineage of the data you are seeing and more.

Catalog browsing
/catalog gives you an interactive, searchable tree, including detail cards of providers/views, links to documentation, lineage, dependencies, uses of providers, etc.
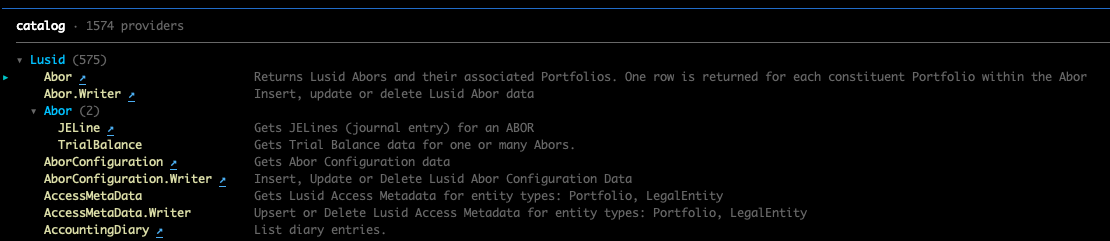
Detail view
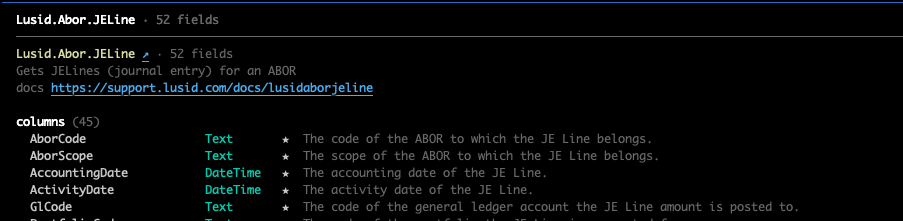

Lineage
You can see everything that depends on a provider / view: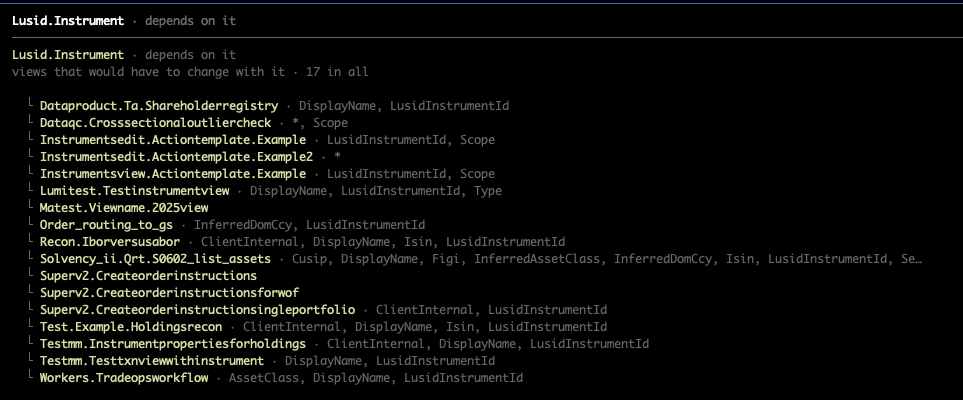
... and everything that a view depends on:
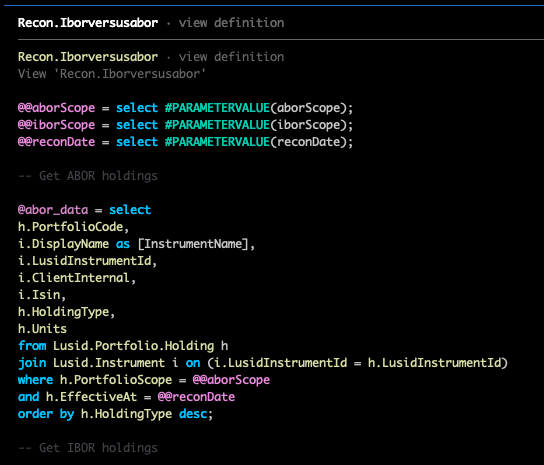
View details
You can see many other view details, such as their definitions, the query that created them (so you can easily update them), etc.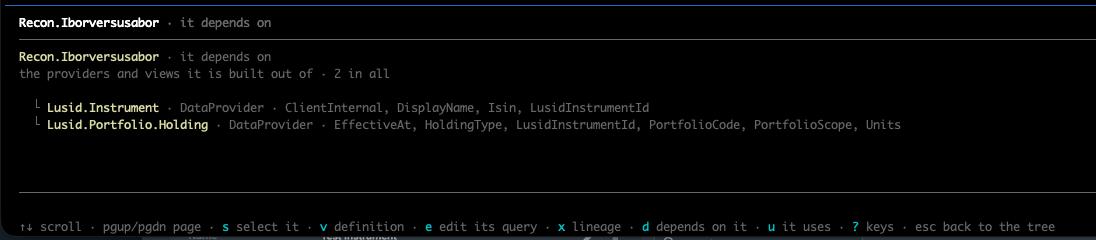
History
Many forms of "user action history" are available in LumiCode.
You can query all of these through providers, but LumiCode also has simple commands with directed user interfaces to view this information. They all start with a time range first, so searches stay fast.
Query history
With /history you can search for queries with various SQL in them and limit to only failed ones. By default you see only your own queries. Users granted the GlobalMetadataVisibility activity on the Sys.Logs.HcQuery provider see queries from everyone in their domain (their organisation's LUSID environment).
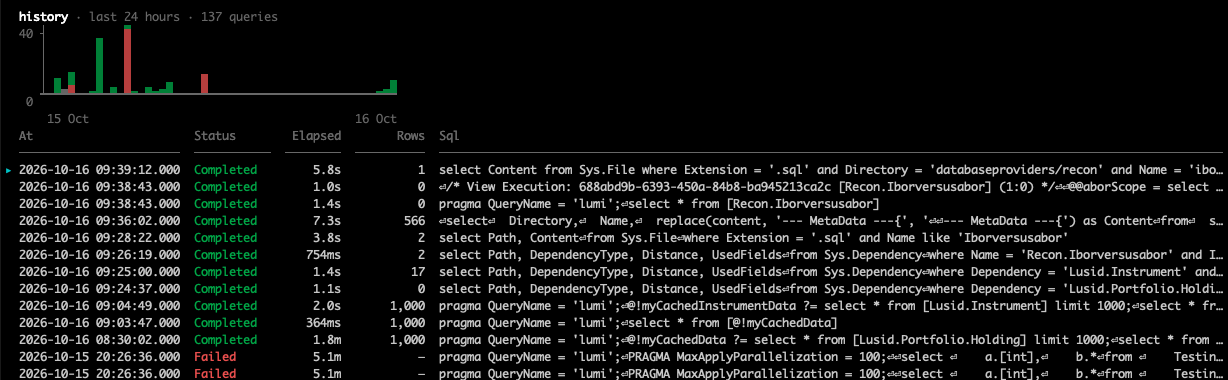
To get a past query back, or its results, see How do I find and re-run a past query? To have a query run by itself on a timetable, see How do I schedule a query from LumiCode?
API call history
With /api-history you can search for API calls for any FINBOURNE application in a given time range, limit to only failed ones (and filter by error message also). By default you see only your own calls; users granted the GlobalMetadataVisibility activity on the Lusid.Logs.AppRequest provider see calls from everyone in their domain.

Access check history
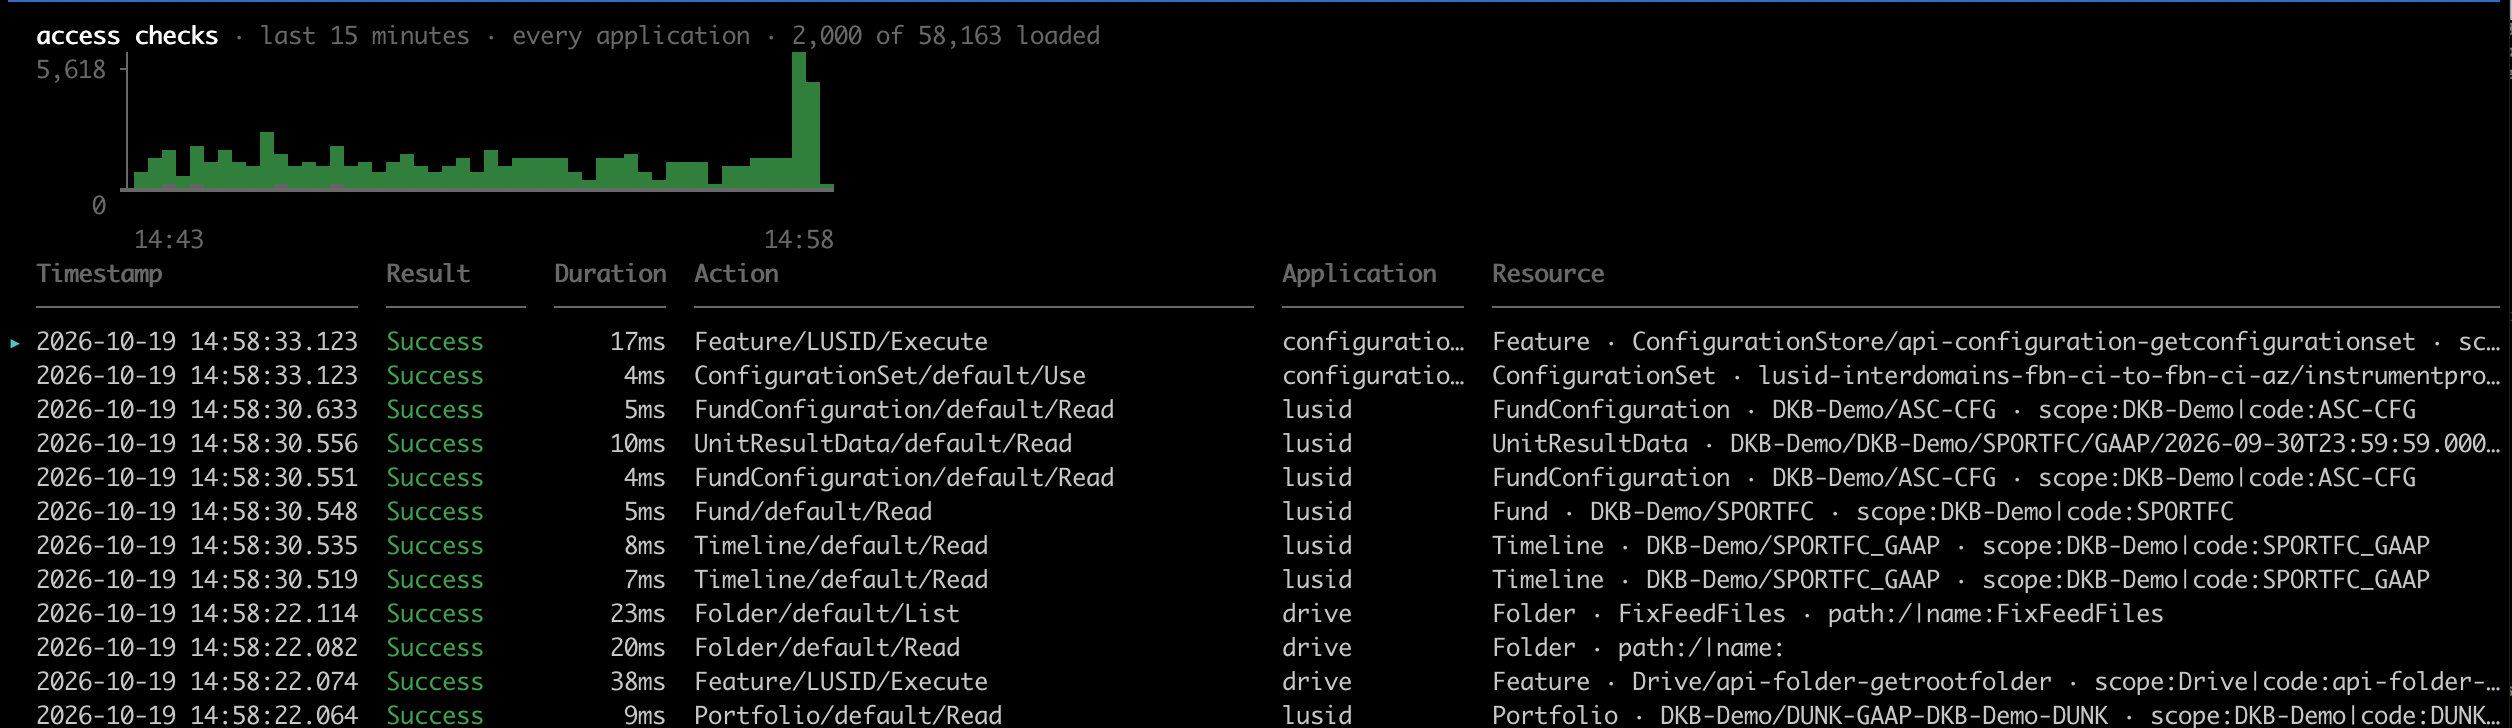
With /access-history you can search for access checks made by any application (or all of them). By default you see only your own access checks; users granted the Insights accesslogs-view-all permission see everyone's in their domain.
Failure diagnosis
/diagnose gathers everything the platform recorded about one query run into a single report: the provider call that actually failed, even inside a view, every execution and provider call with its timings, and the full feedback log. You can save the report as Markdown for FINBOURNE Support or an AI assistant.

To use it, see How do I diagnose a failed query?