In this tutorial we’ll see how to get started with Luminesce by running a simple query to retrieve a portfolio valuation from LUSID itself.
We'll also explore the visualisation tools built into the LUSID web app that help extract simple business intelligence from query results.
Note: This tutorial assumes you have a LUSID user account. If not, sign up for a free trial. It also assumes your LUSID domain has a license to use Luminesce. If you can't see the menu in Step 1 when you sign in to the LUSID web app, contact Technical Support for a trial license.
To complete this tutorial, you must have suitable permissions. This can most easily be achieved by assigning your LUSID user the built-in lusid-administrator role. This should already be the case if you are the domain owner.
Step 1: Exploring Luminesce in the LUSID web app
To get started with Luminesce, open the Query Editor dashboard:
Sign in to the LUSID web app using your LUSID administrator credentials.
From the left-hand menu, select Data Virtualisation > Query Editor:

The Available Catalogues area on the right lists all the data sources you can use Luminesce to query. Strictly speaking, these are all the sources for which a provider exists that you have permission to use:
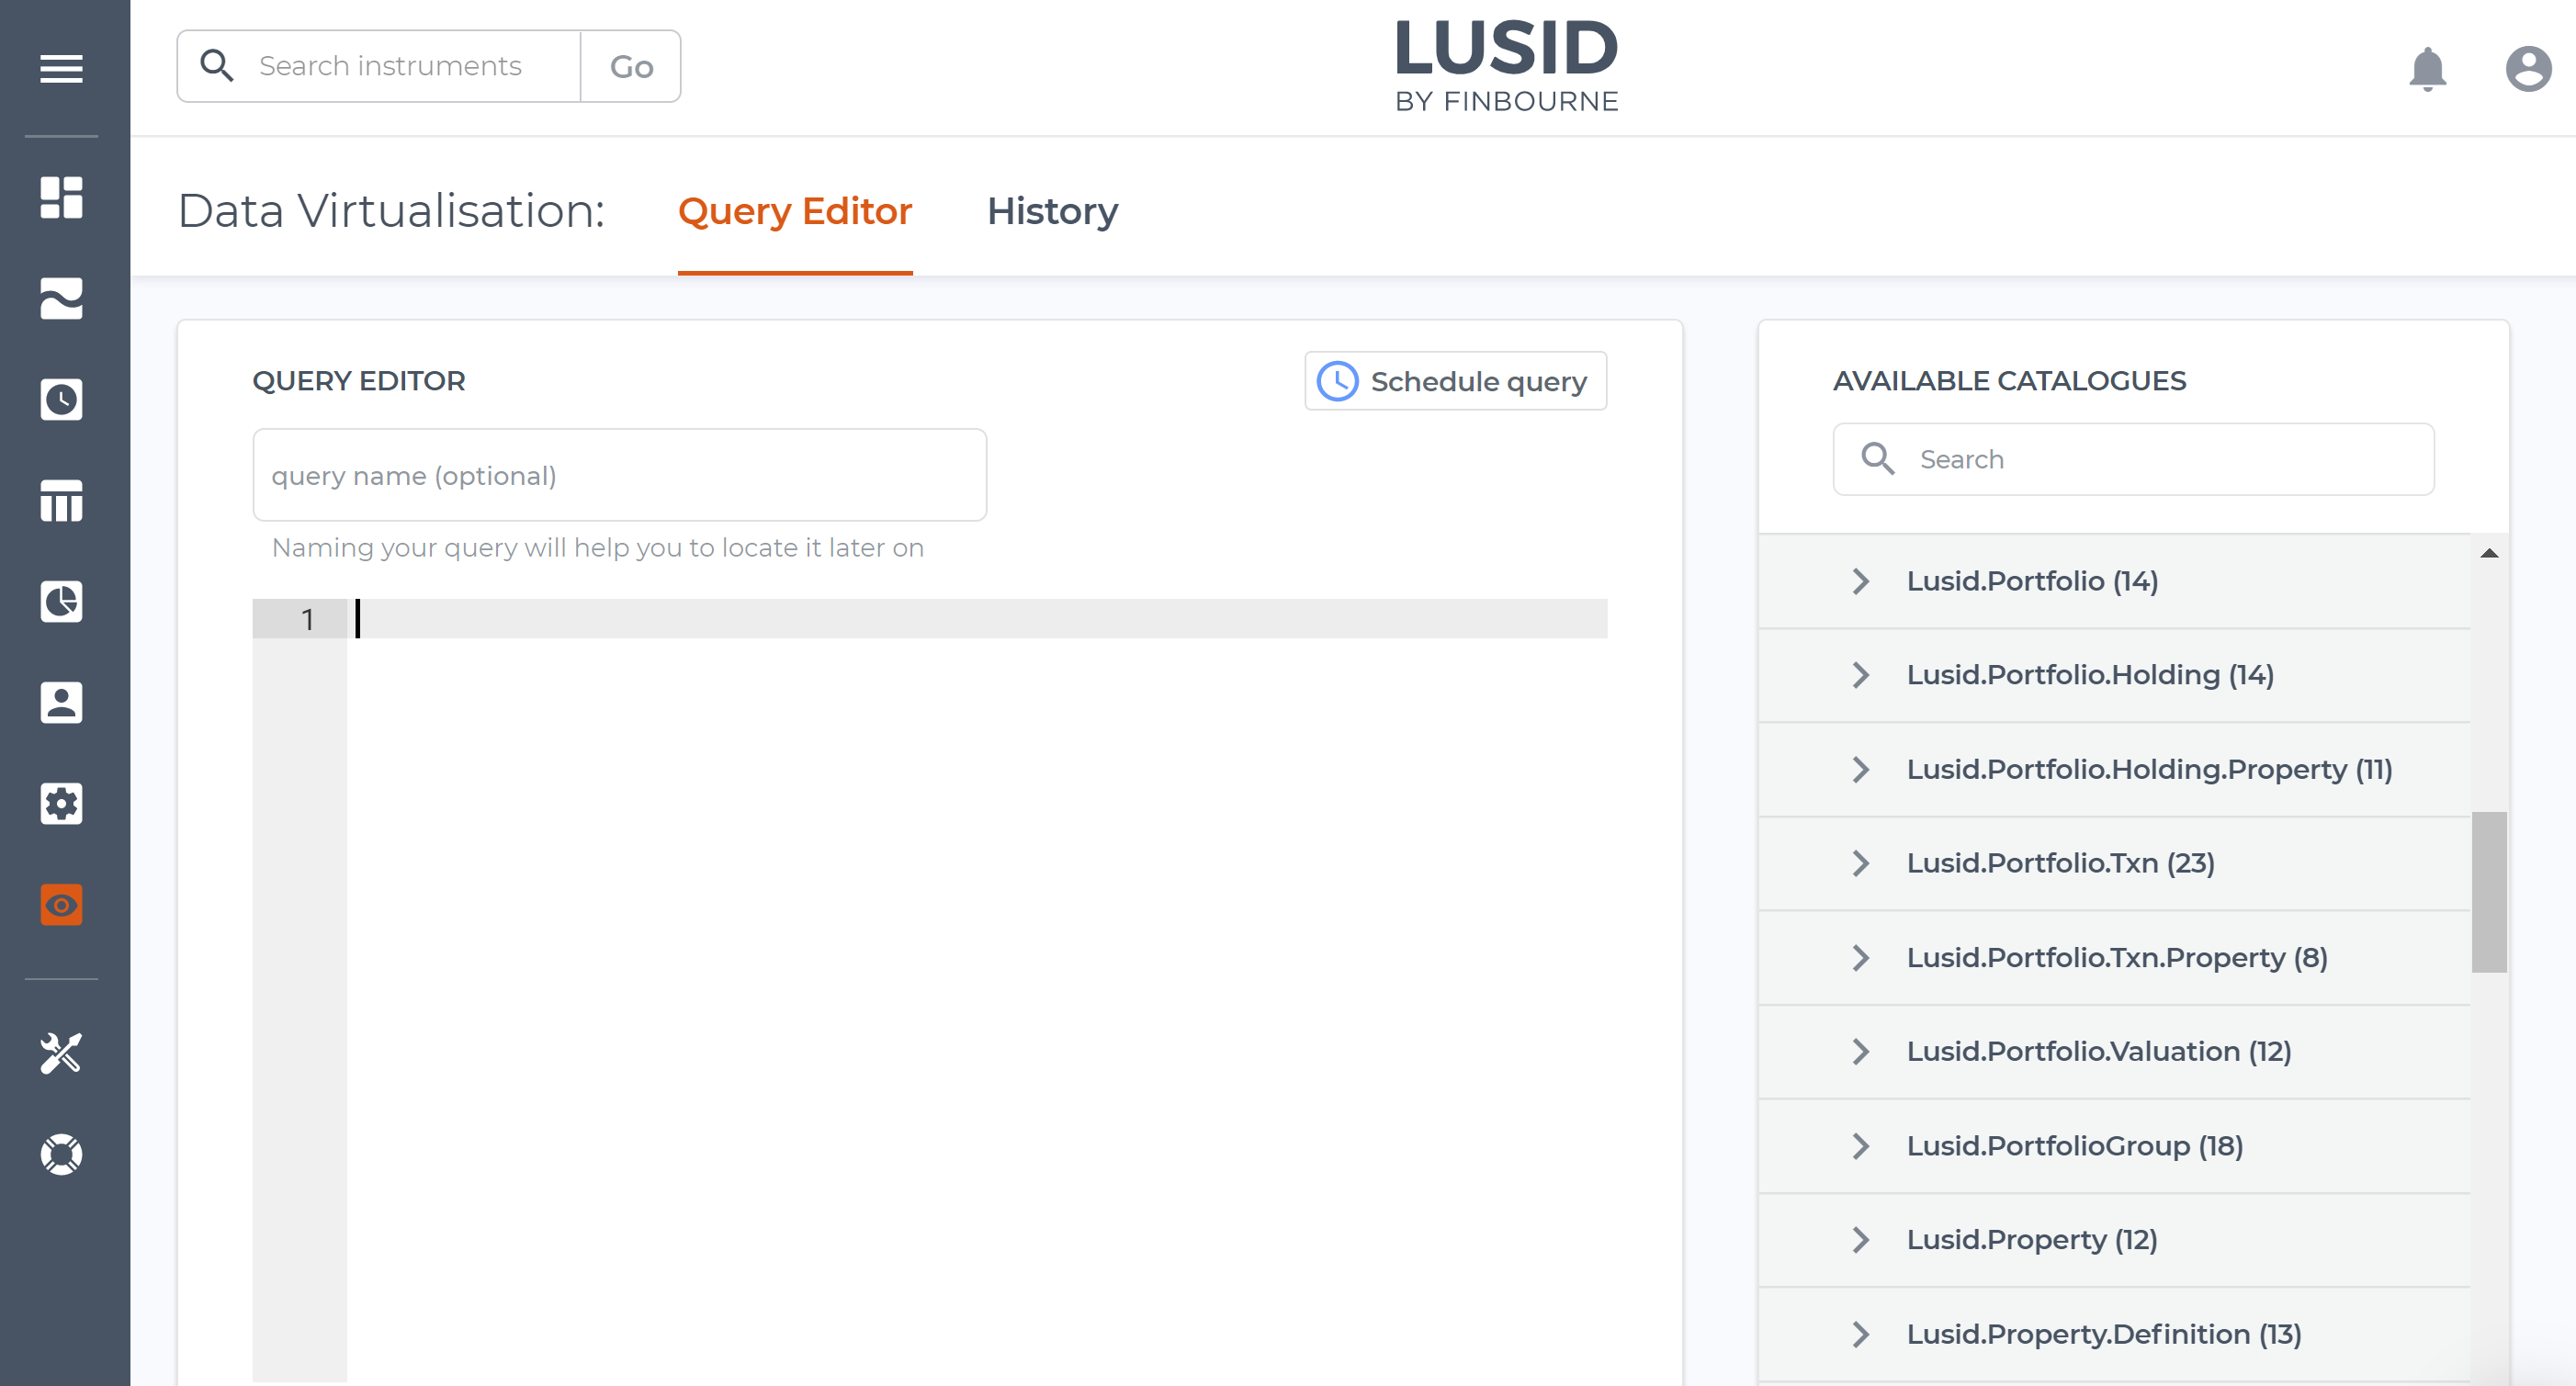
In this example, we can see the list includes certain types of investment data booked into LUSID itself: portfolios, holdings and transactions in those portfolios, properties in those domains, portfolio valuations, and more.
If you examine further up this list, you'll see that as well as providers for retrieving data there are also providers for writing it. For example, Drive.SaveAs and Lusid.Instrument.Writer are special providers that write data from external sources back into Drive and LUSID respectively; we'll explore these later.
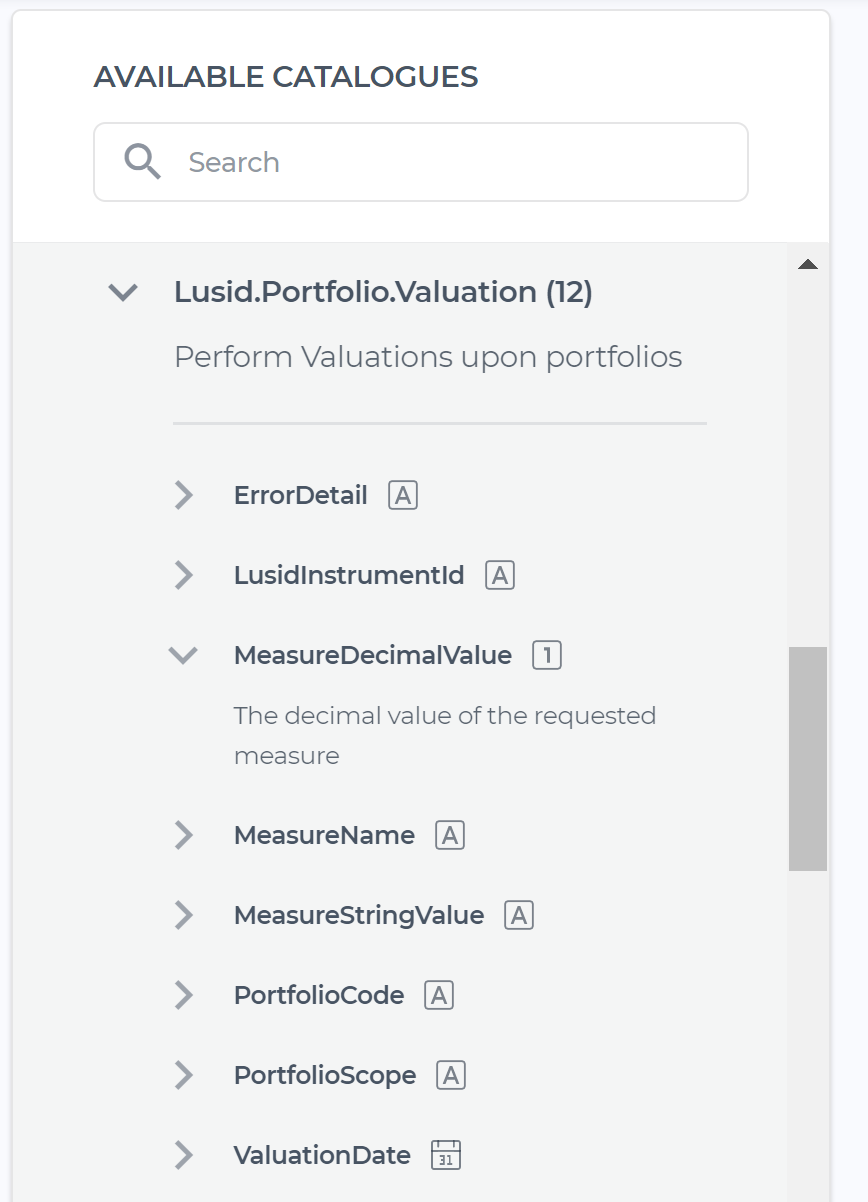
Open a particular catalog to see all the fields you can retrieve or query, plus help for those fields and their data types (hover over icons for details):
Step 2: Writing a simple query to retrieve a portfolio valuation
Luminesce queries are written in the SQL dialect of SQLite (with a few syntactical extensions and limitations).
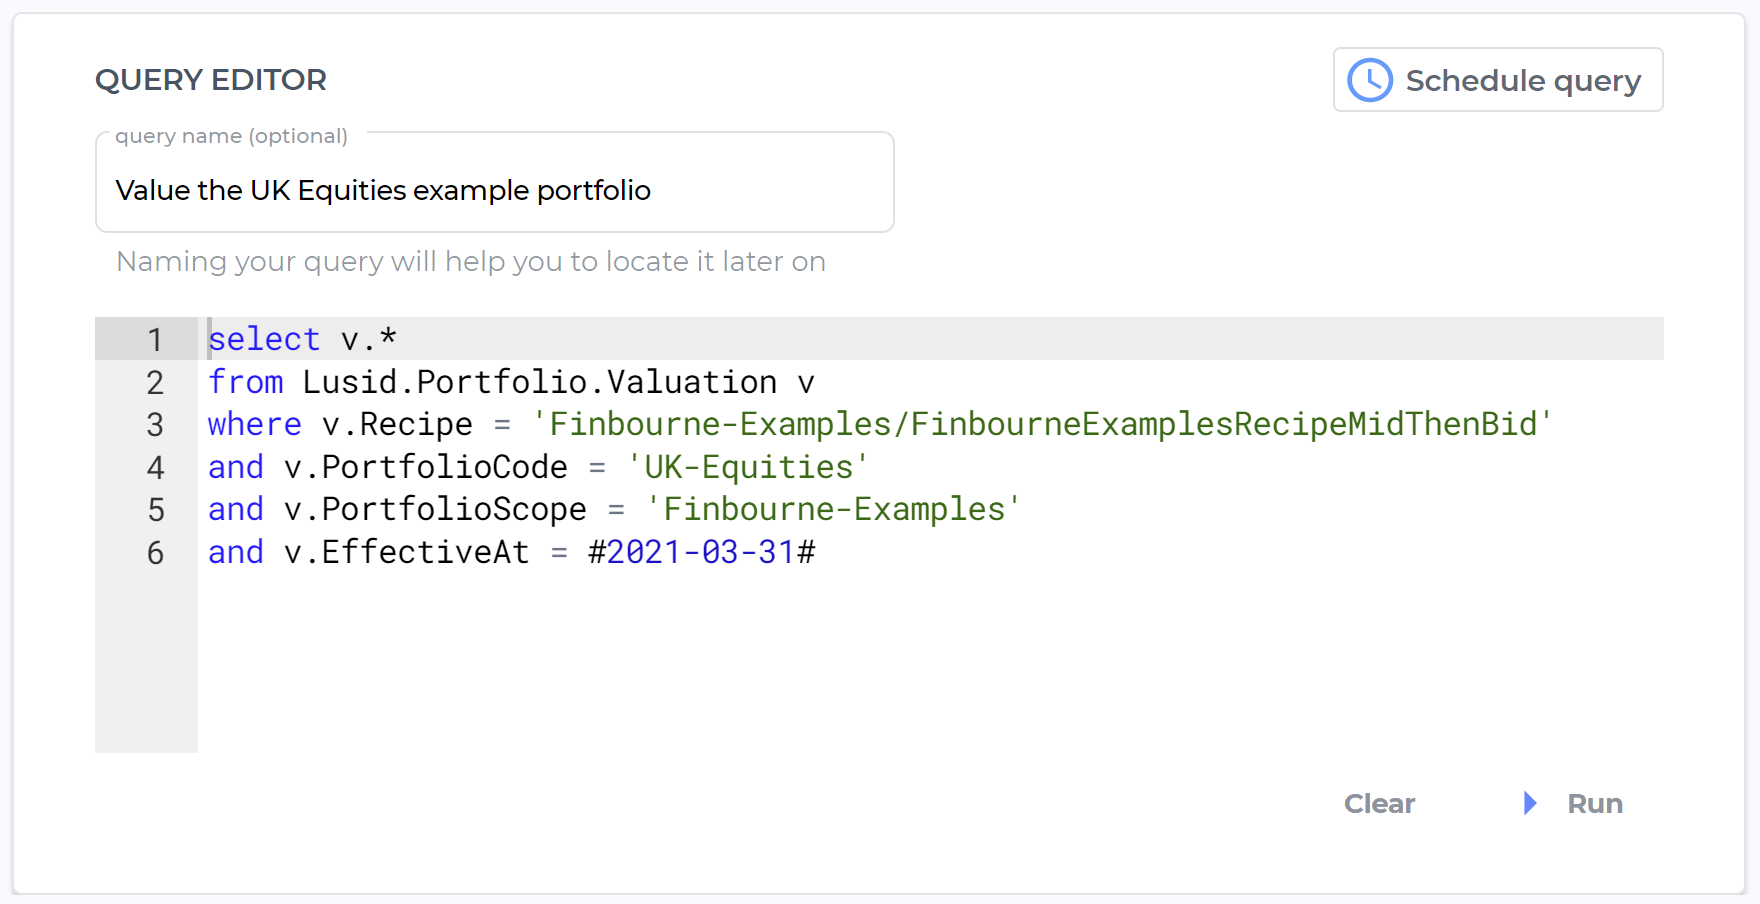
For example, this query:
select v.*
from Lusid.Portfolio.Valuation v
where v.Recipe = 'Finbourne-Examples/FinbourneExamplesRecipeMidThenBid'
and v.PortfolioCode = 'UK-Equities'
and v.PortfolioScope = 'Finbourne-Examples'
and v.EffectiveAt = #2021-03-31#
retrieves all the fields available in the Lusid.Portfolio.Valuation provider
for a particular example portfolio provided with LUSID (with scope Finbourne-Examples and code UK-Equities)
calculates a valuation for that portfolio using a particular example recipe (with scope Finbourne-Examples and code FinbourneExamplesRecipeMidThenBid)
at the end of the first quarter 2021 (note dates in Luminesce queries must be enclosed in # symbols):
Step 3: Running the query and viewing results
Click the Run button (bottom right) to run the query. Note it may take a little while if the dataset is large or the calculations being performed are complex, but you see a log of progress:
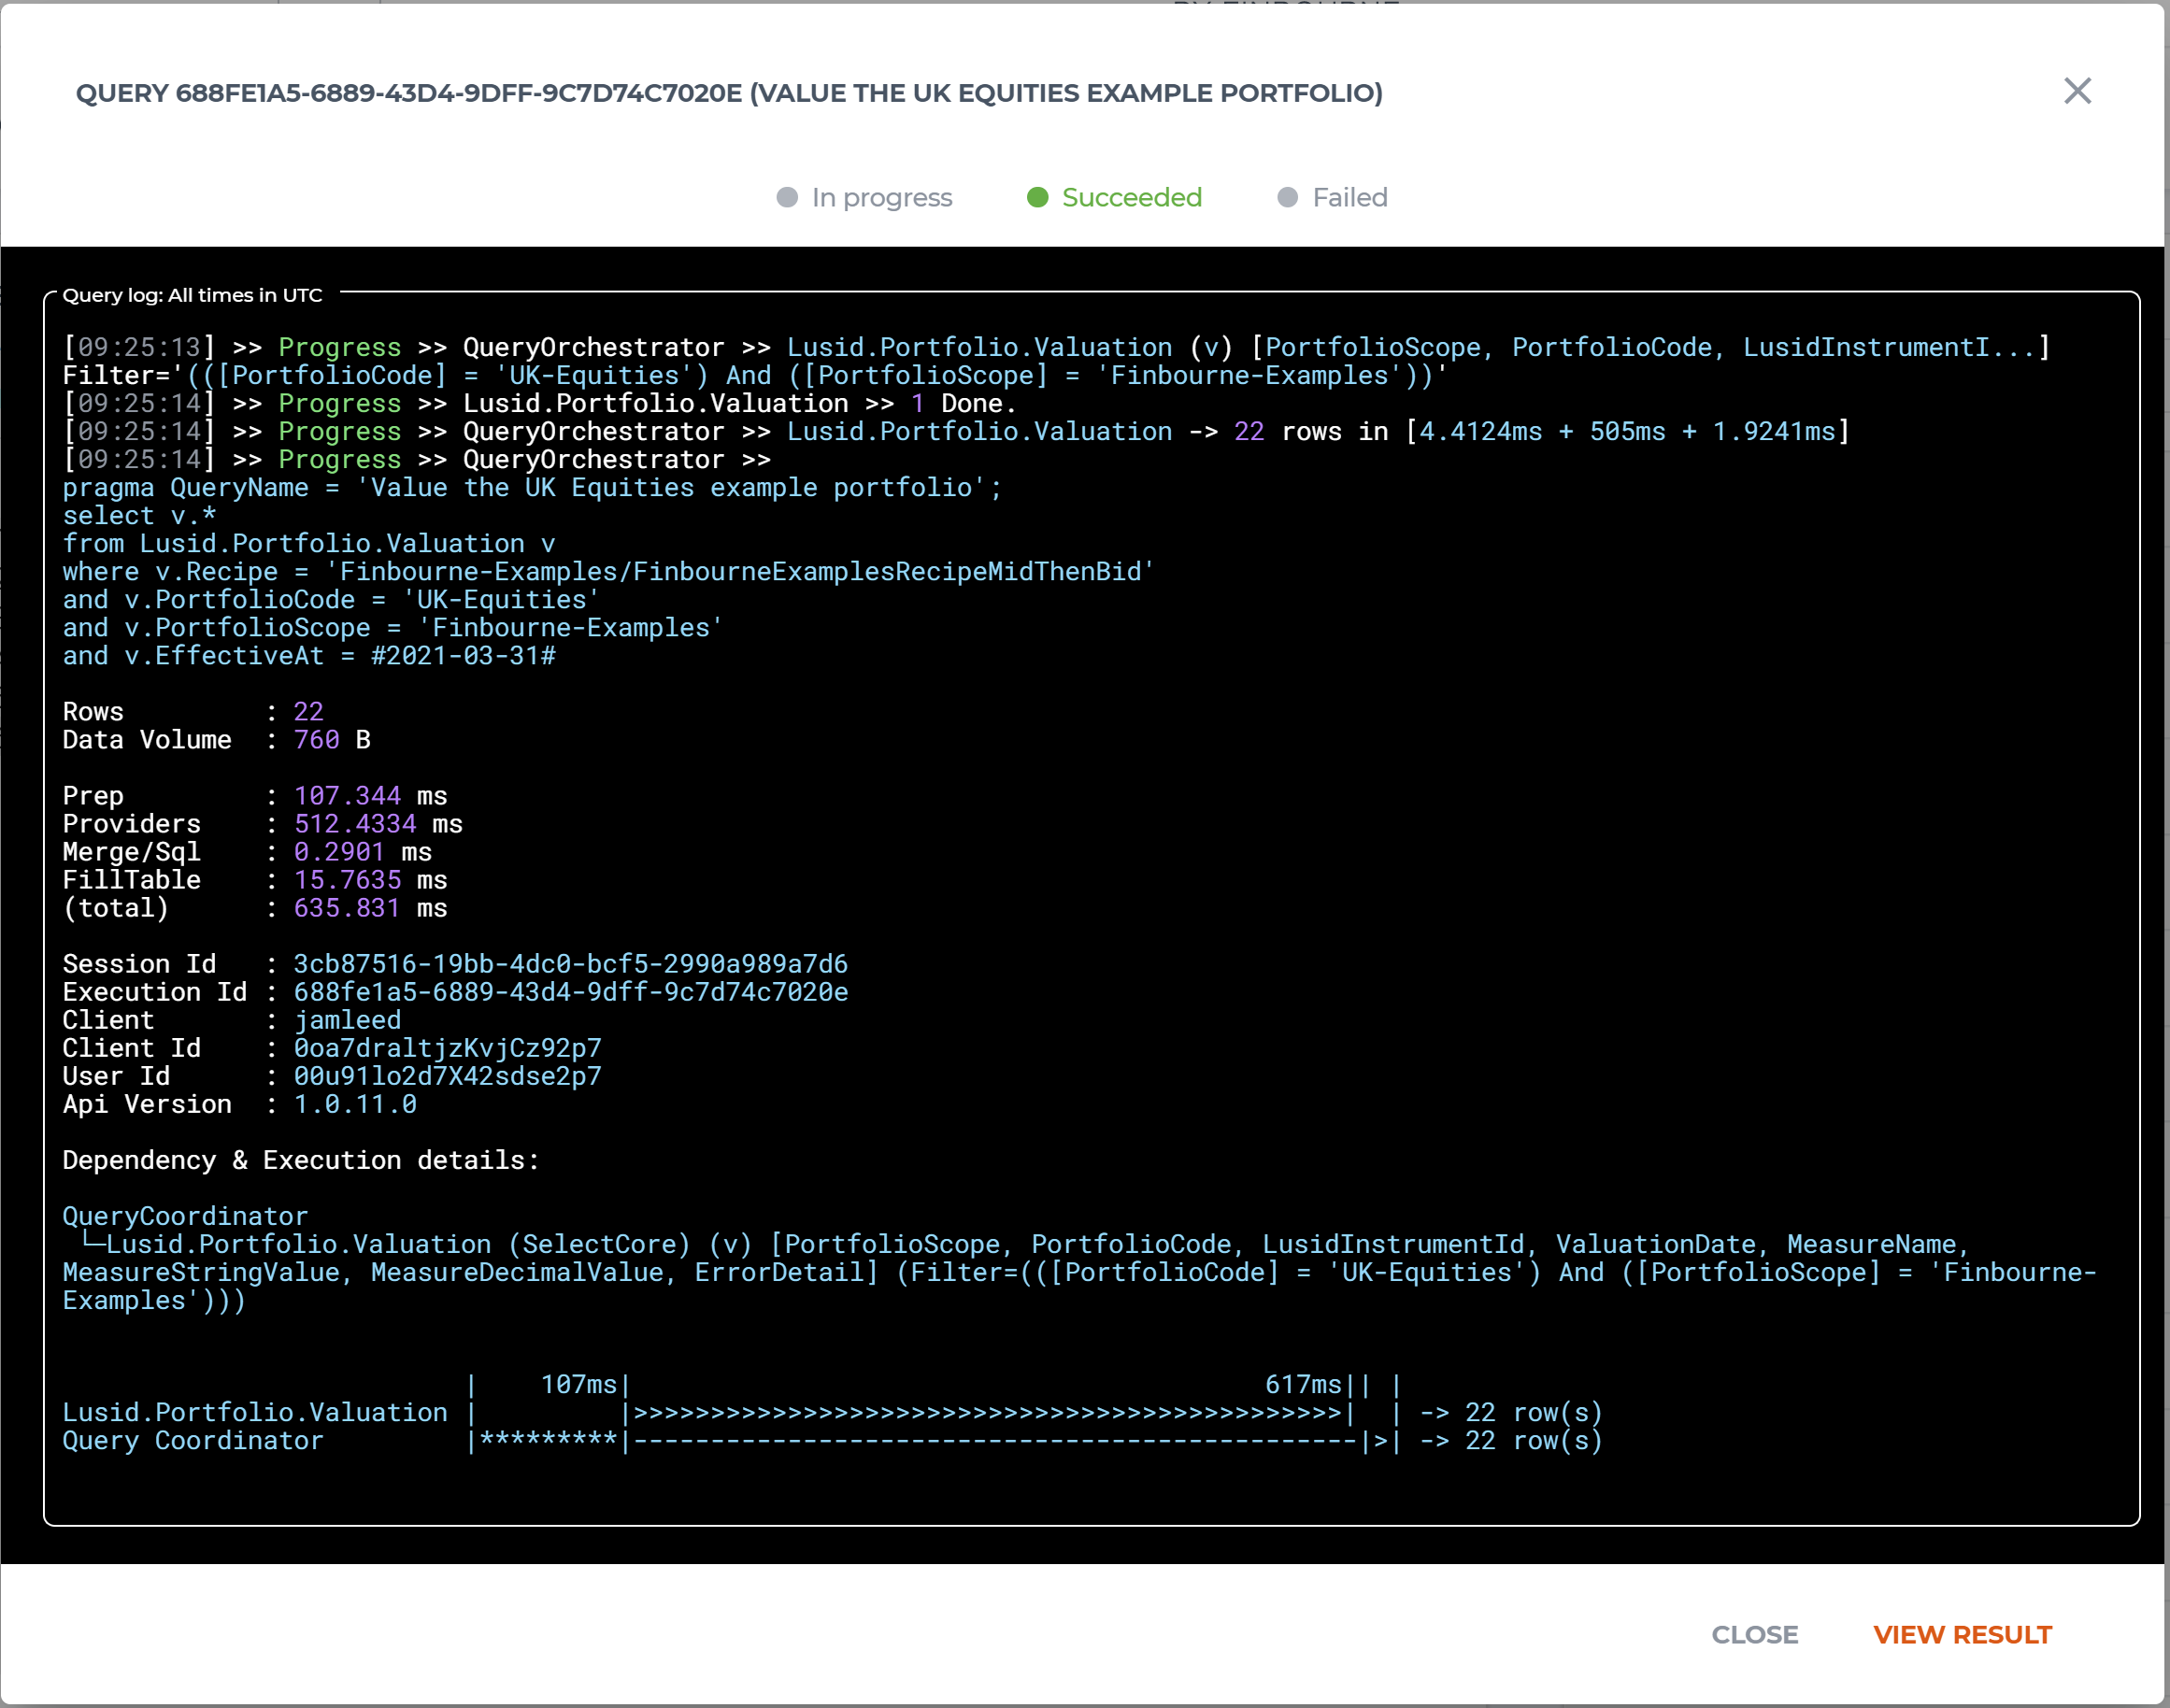
We can see that the query Succeeded; click the View result button to navigate to the History dashboard and see a table of results:
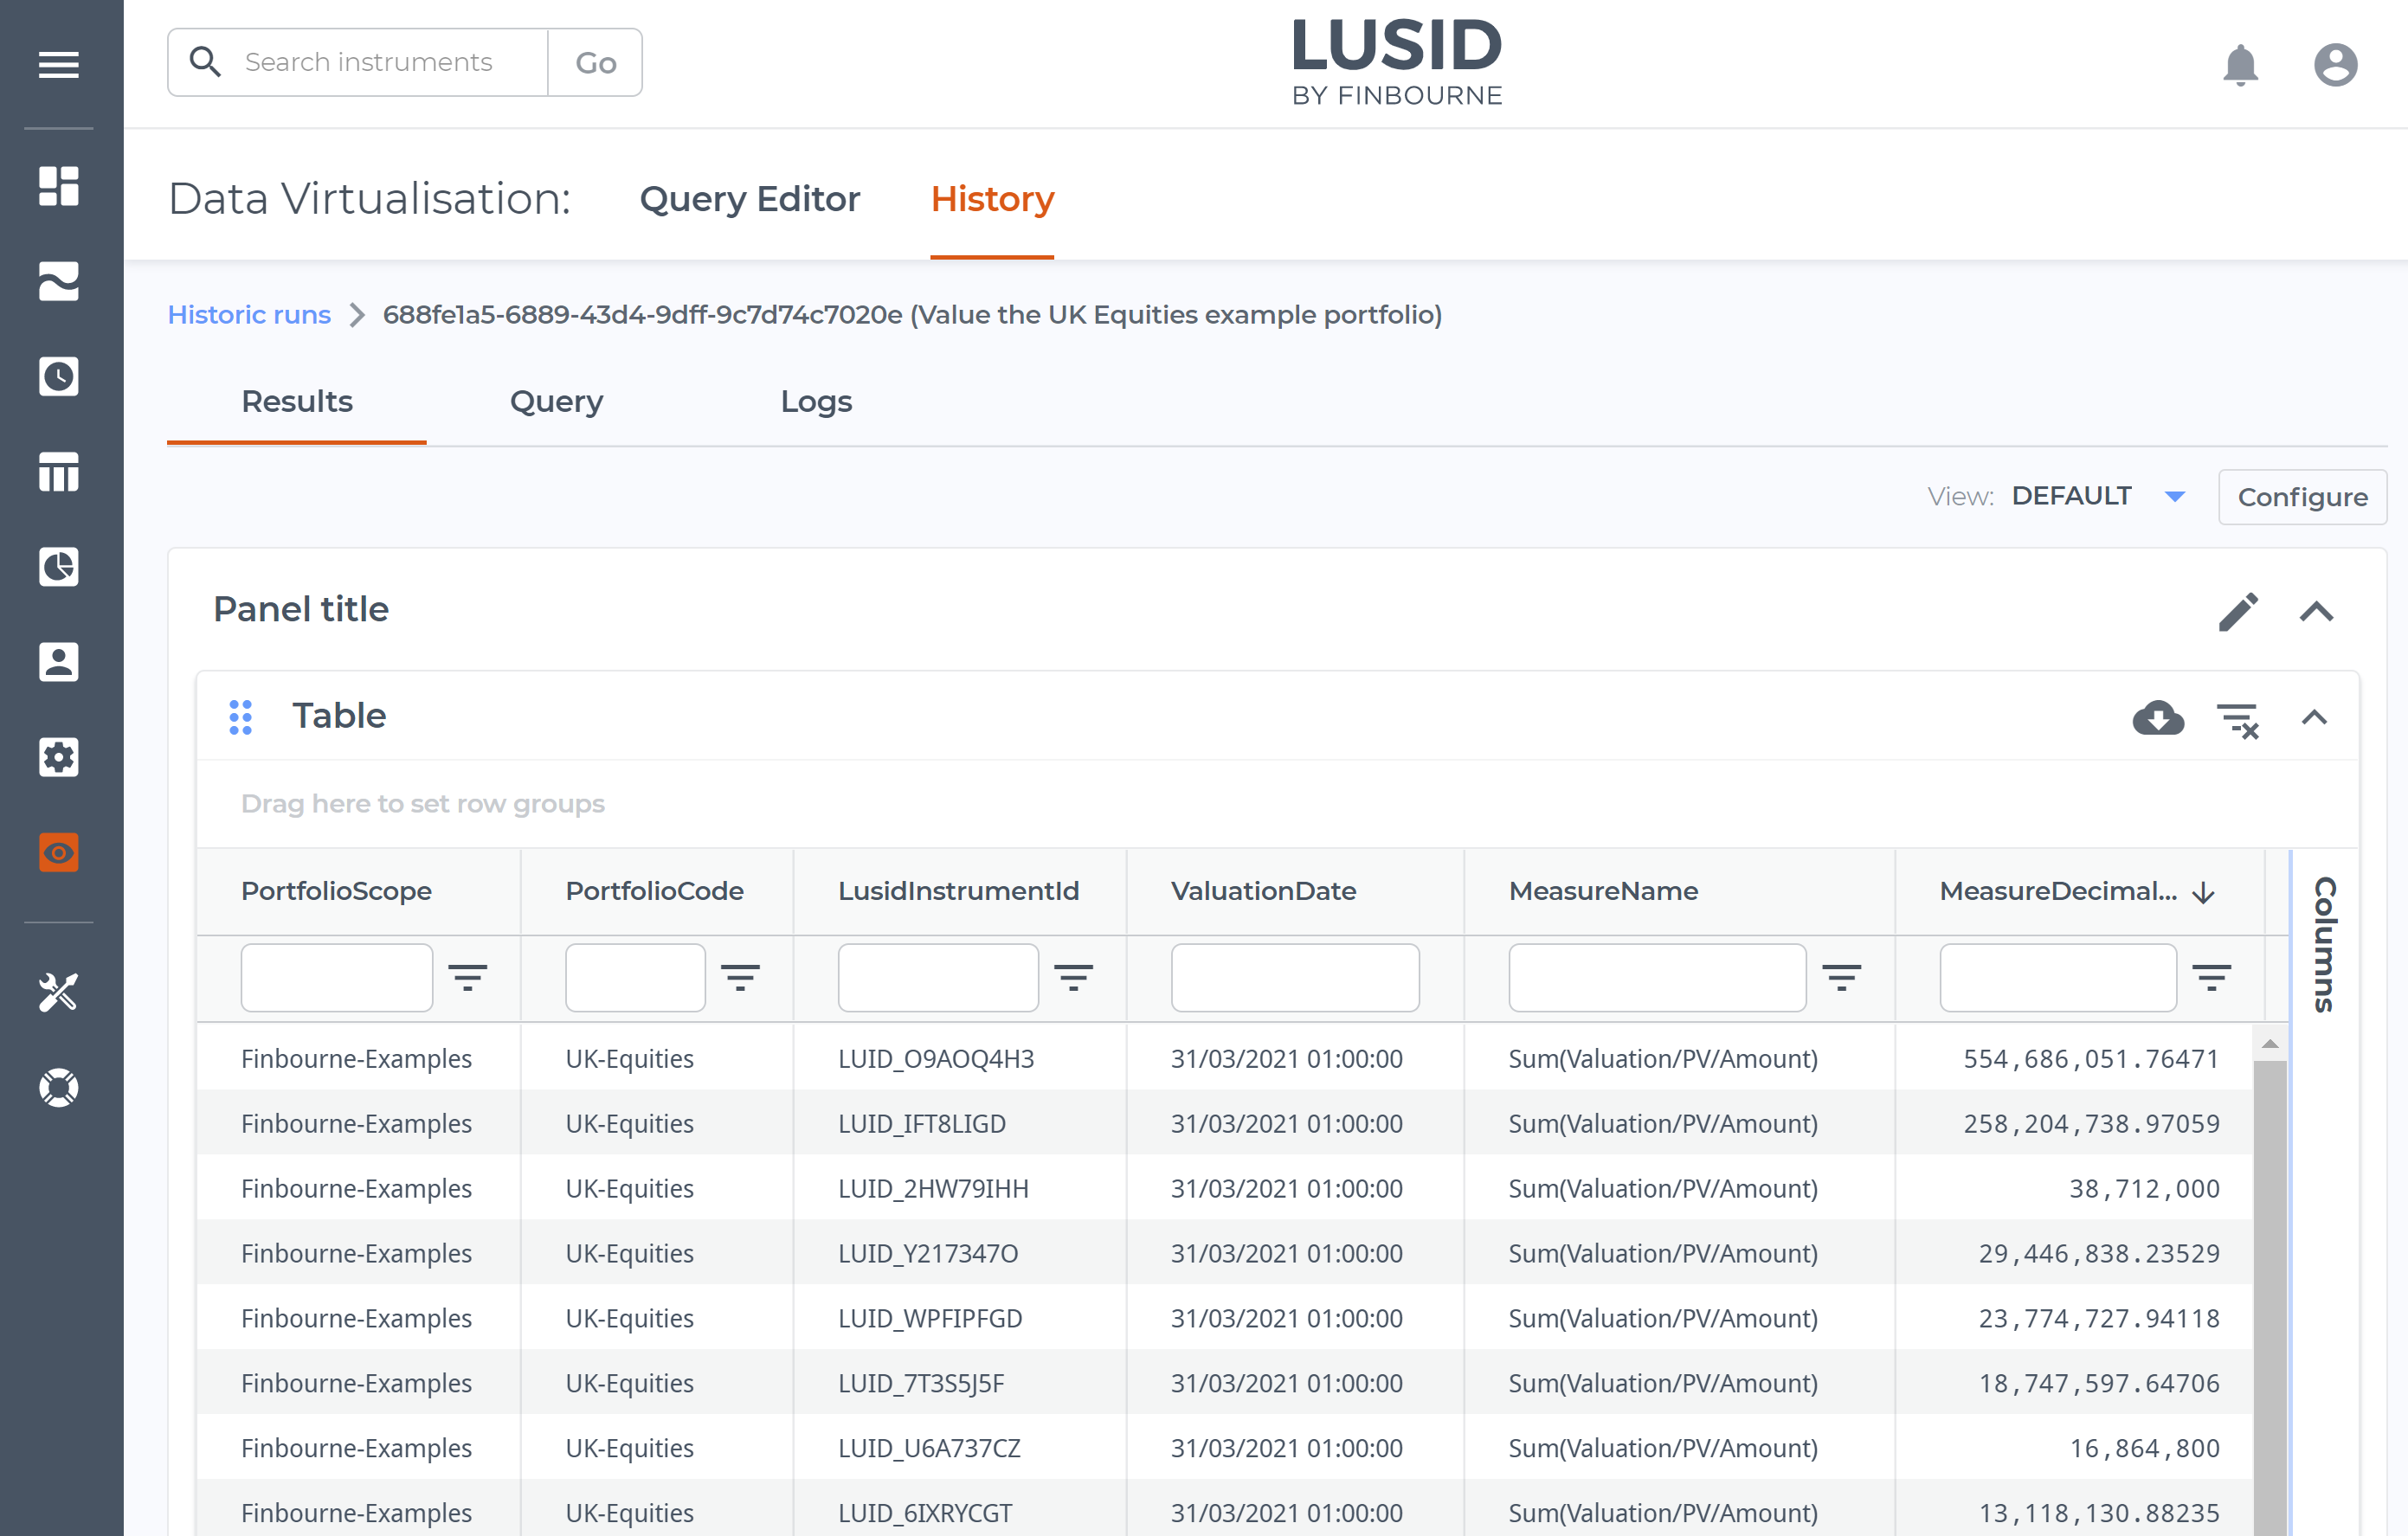
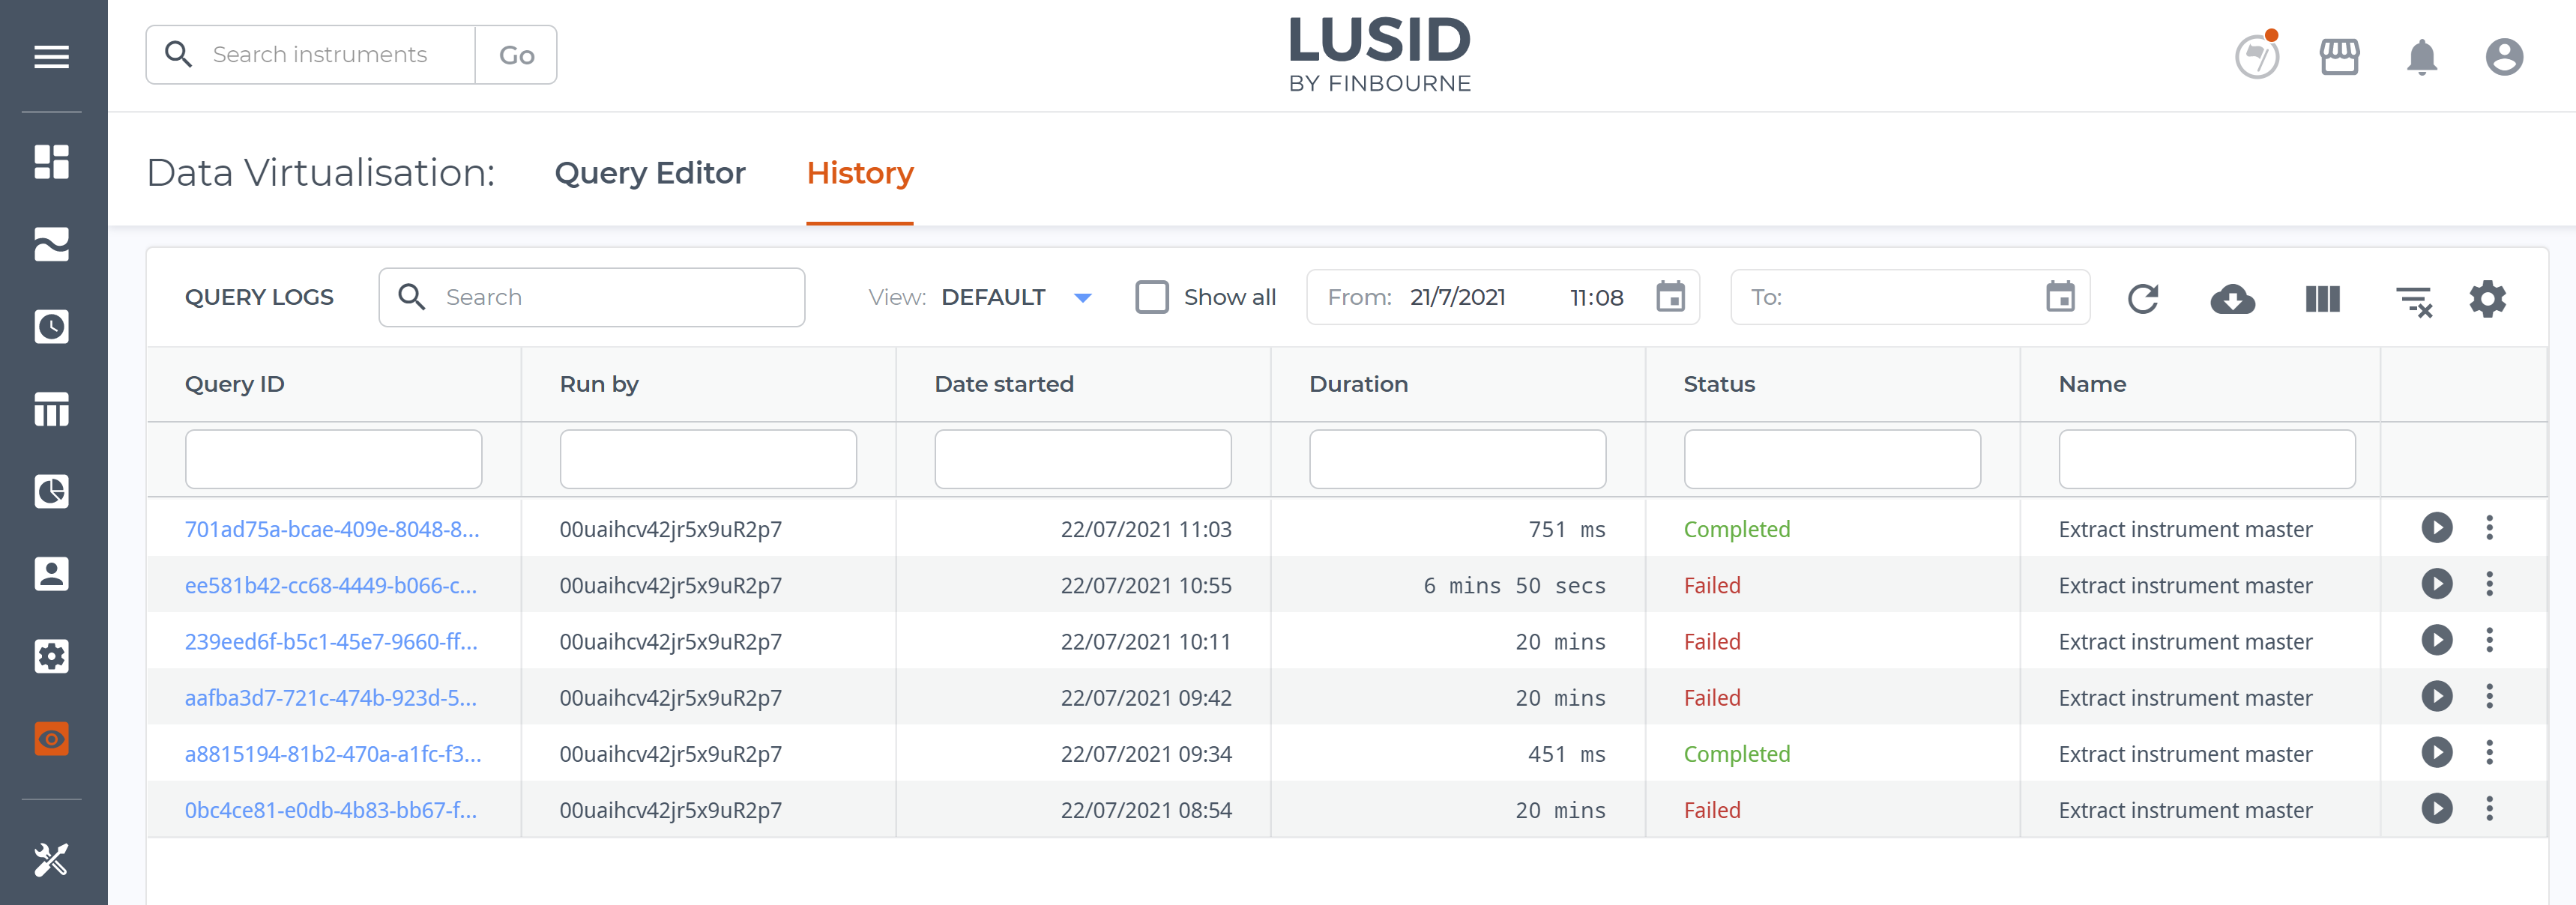
Note you can click the Historic runs breadcrumb link (top left) to see a history of all queries:
Step 4: Visualising results to extract business intelligence
LUSID has a simple charting facility to help make tables of results more consumable:
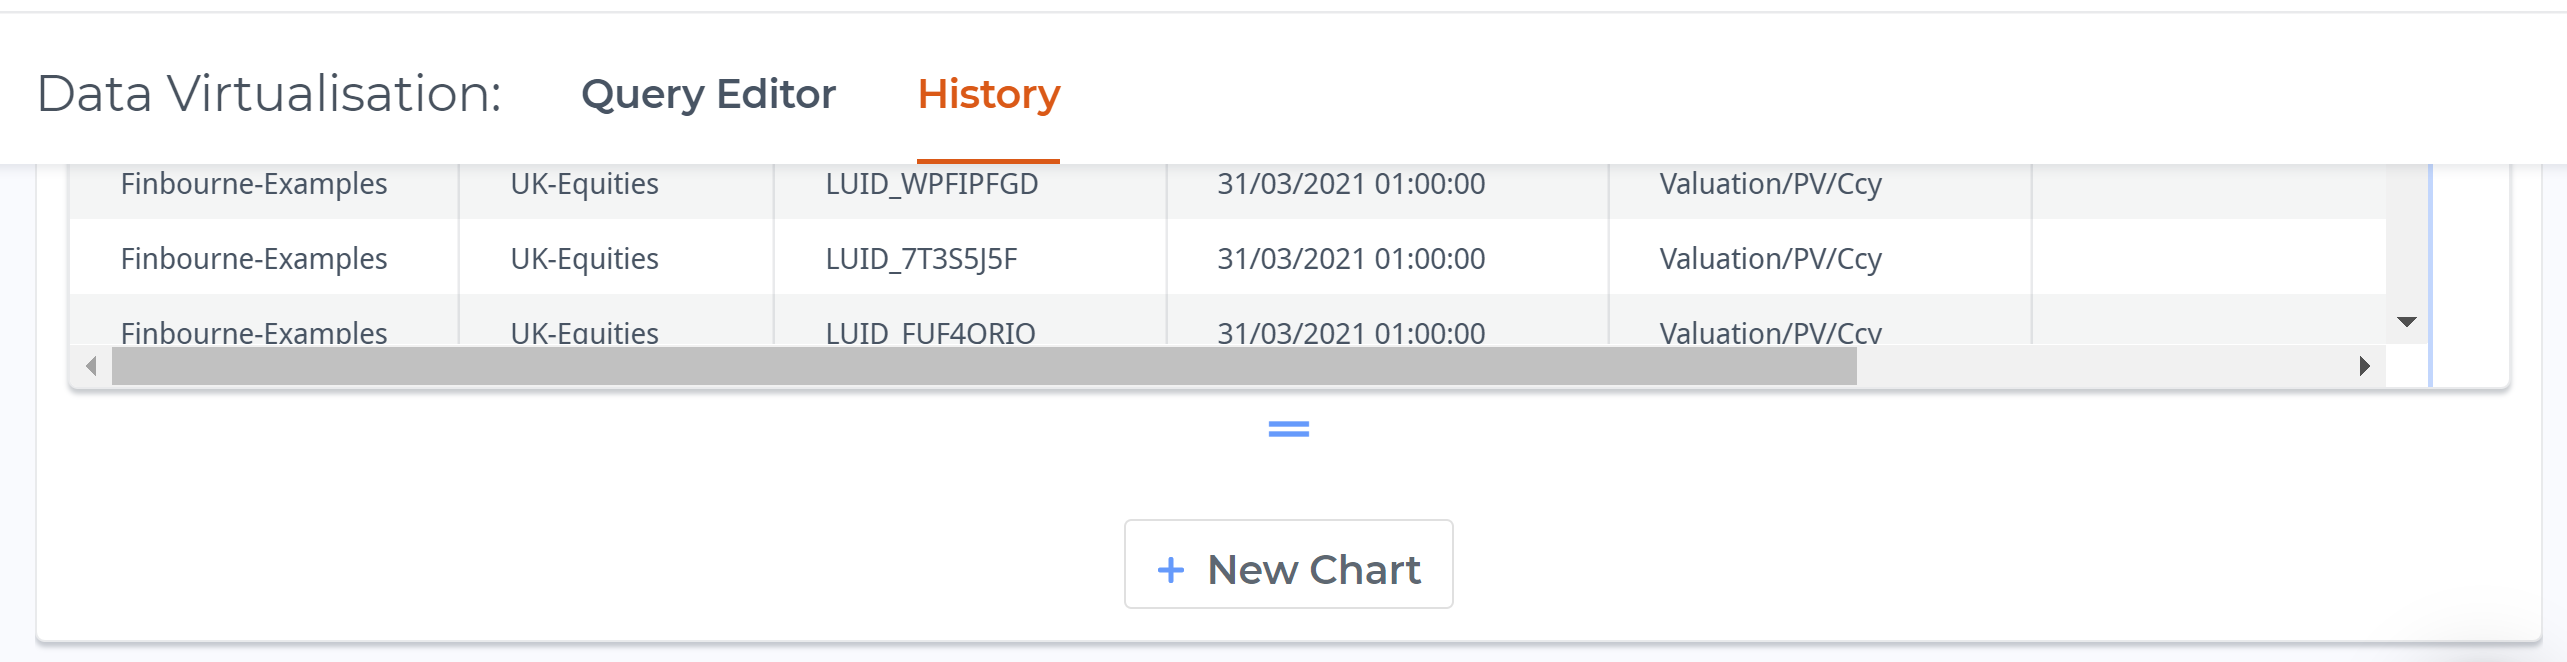
On the History dashboard for our valuation query, click the New Chart button (underneath the table):
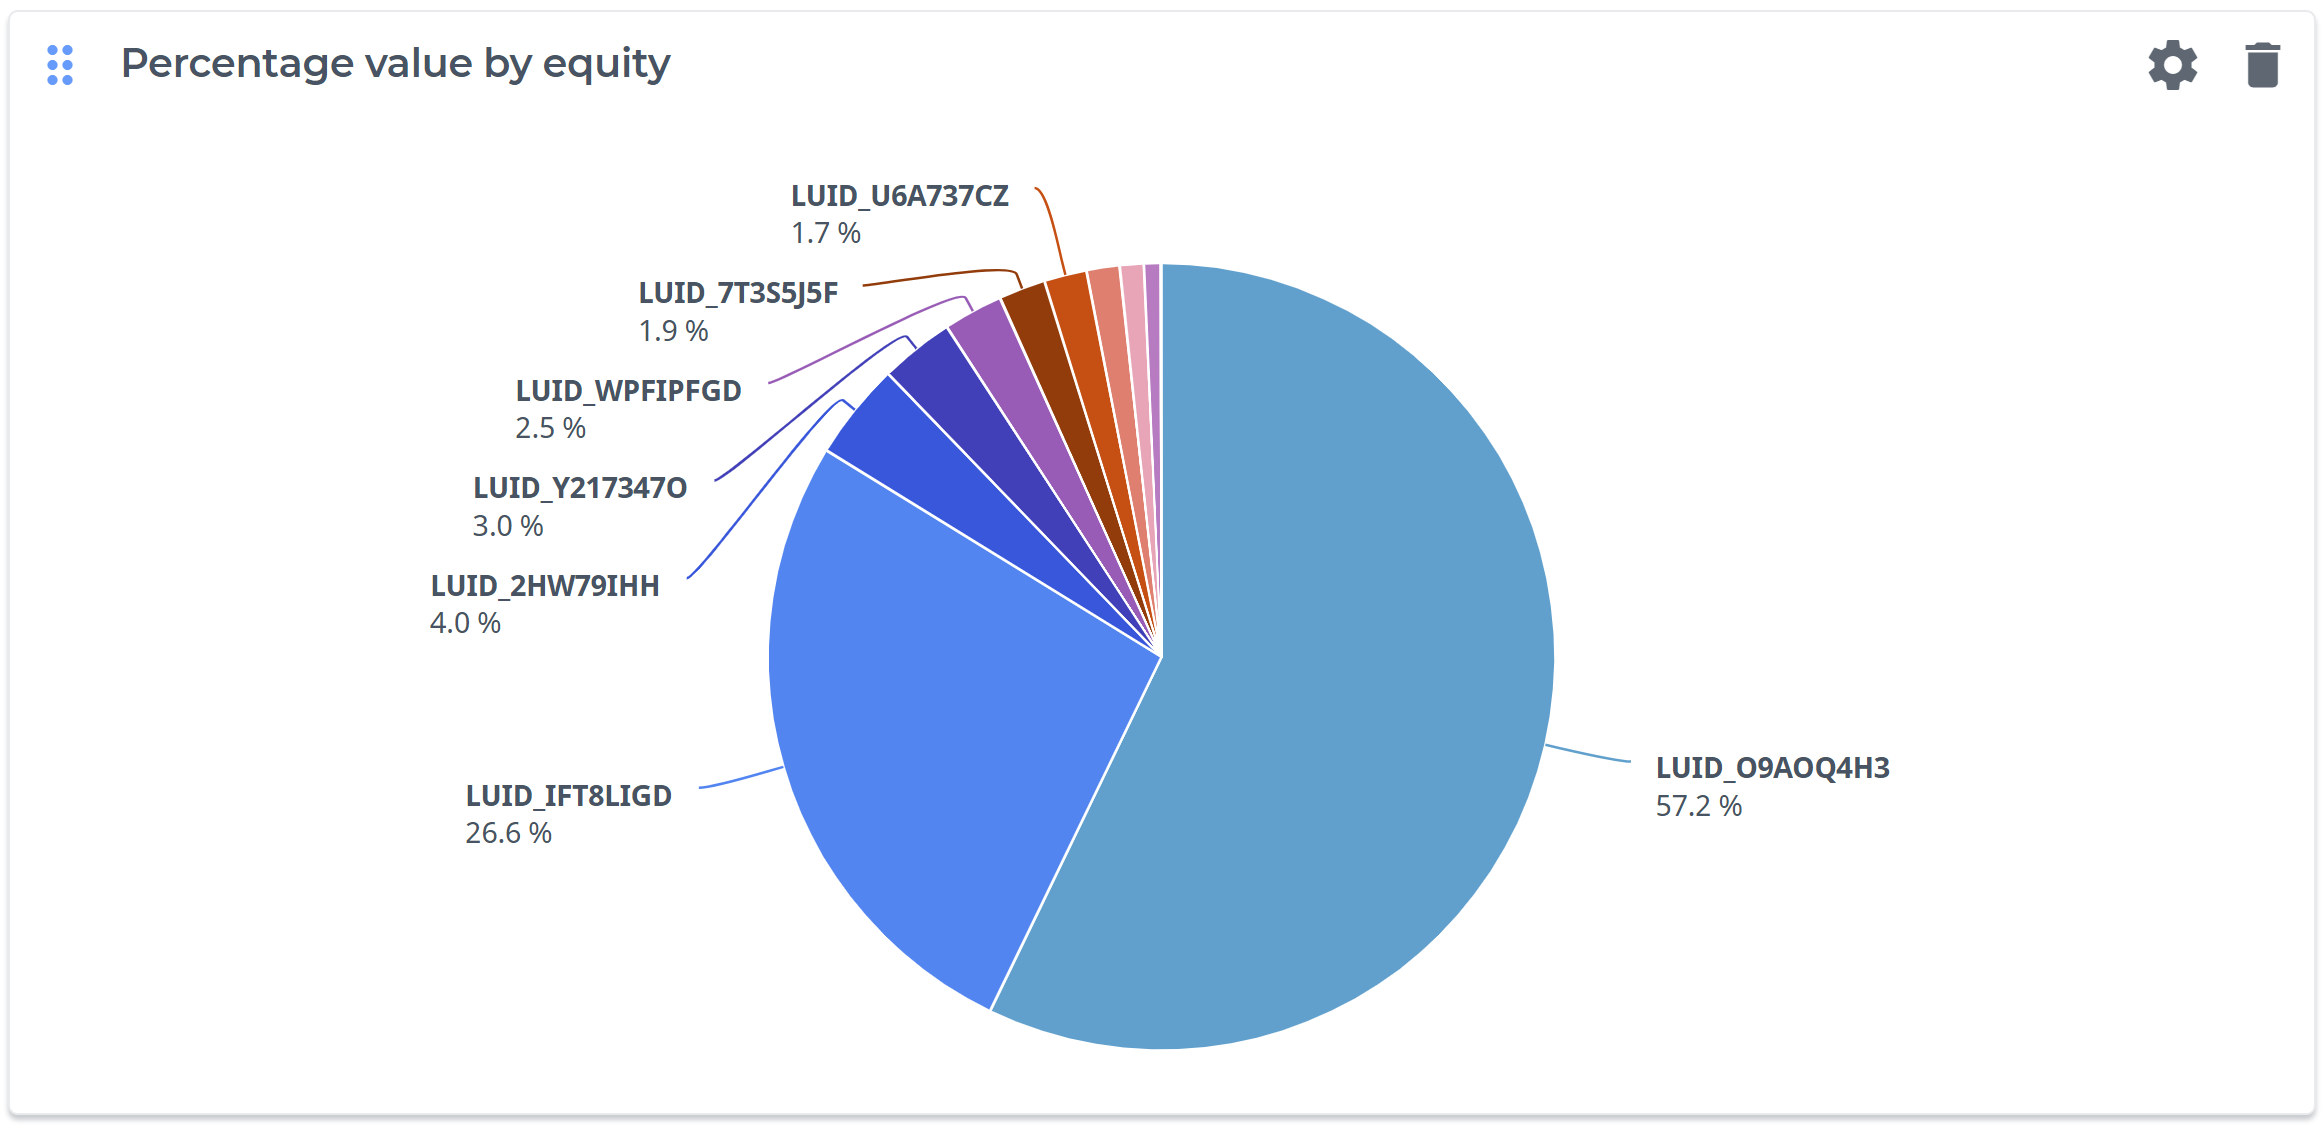
Specify Pie chart, a Value to measure, and a Label:
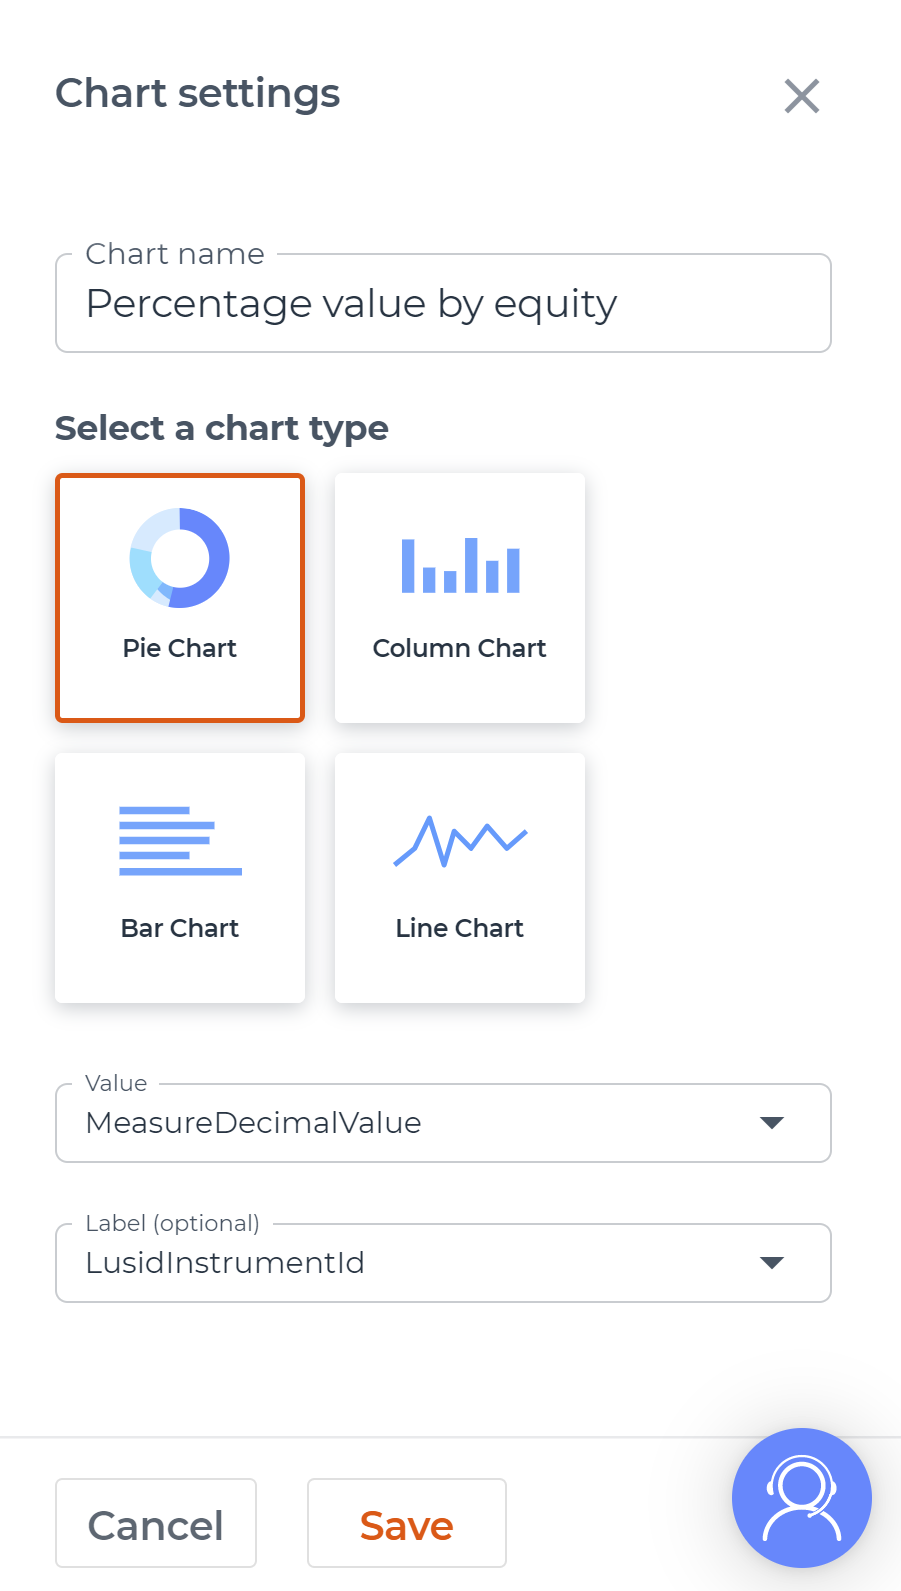
Click the Save button. We can see that the most valuable equity in the portfolio is one with a LUID (LUSID internal identifier) of LUID_O9AOQ4H3:
Step 5: Amending the query to retrieve data from a different provider
This isn't particularly helpful. Let's amend and re-run the query, this time pulling in data from a different provider to map LUIDs to recognisable equity names:
Navigate back to the Query Editor dashboard.
Amend the query to pull in data from the Lusid.Instrument provider, which has a DisplayName field storing equity names. We can join the two datasets on their shared LusidInstrumentId field (new query instructions in bold):
select v.*, i.DisplayName
from Lusid.Portfolio.Valuation v
inner join Lusid.Instrument i on v.LusidInstrumentId = i.LusidInstrumentId
where v.Recipe = 'Finbourne-Examples/FinbourneExamplesRecipeMidThenBid'
and v.PortfolioCode = 'UK-Equities'
and v.PortfolioScope = 'Finbourne-Examples'
and v.EffectiveAt = #2021-03-31#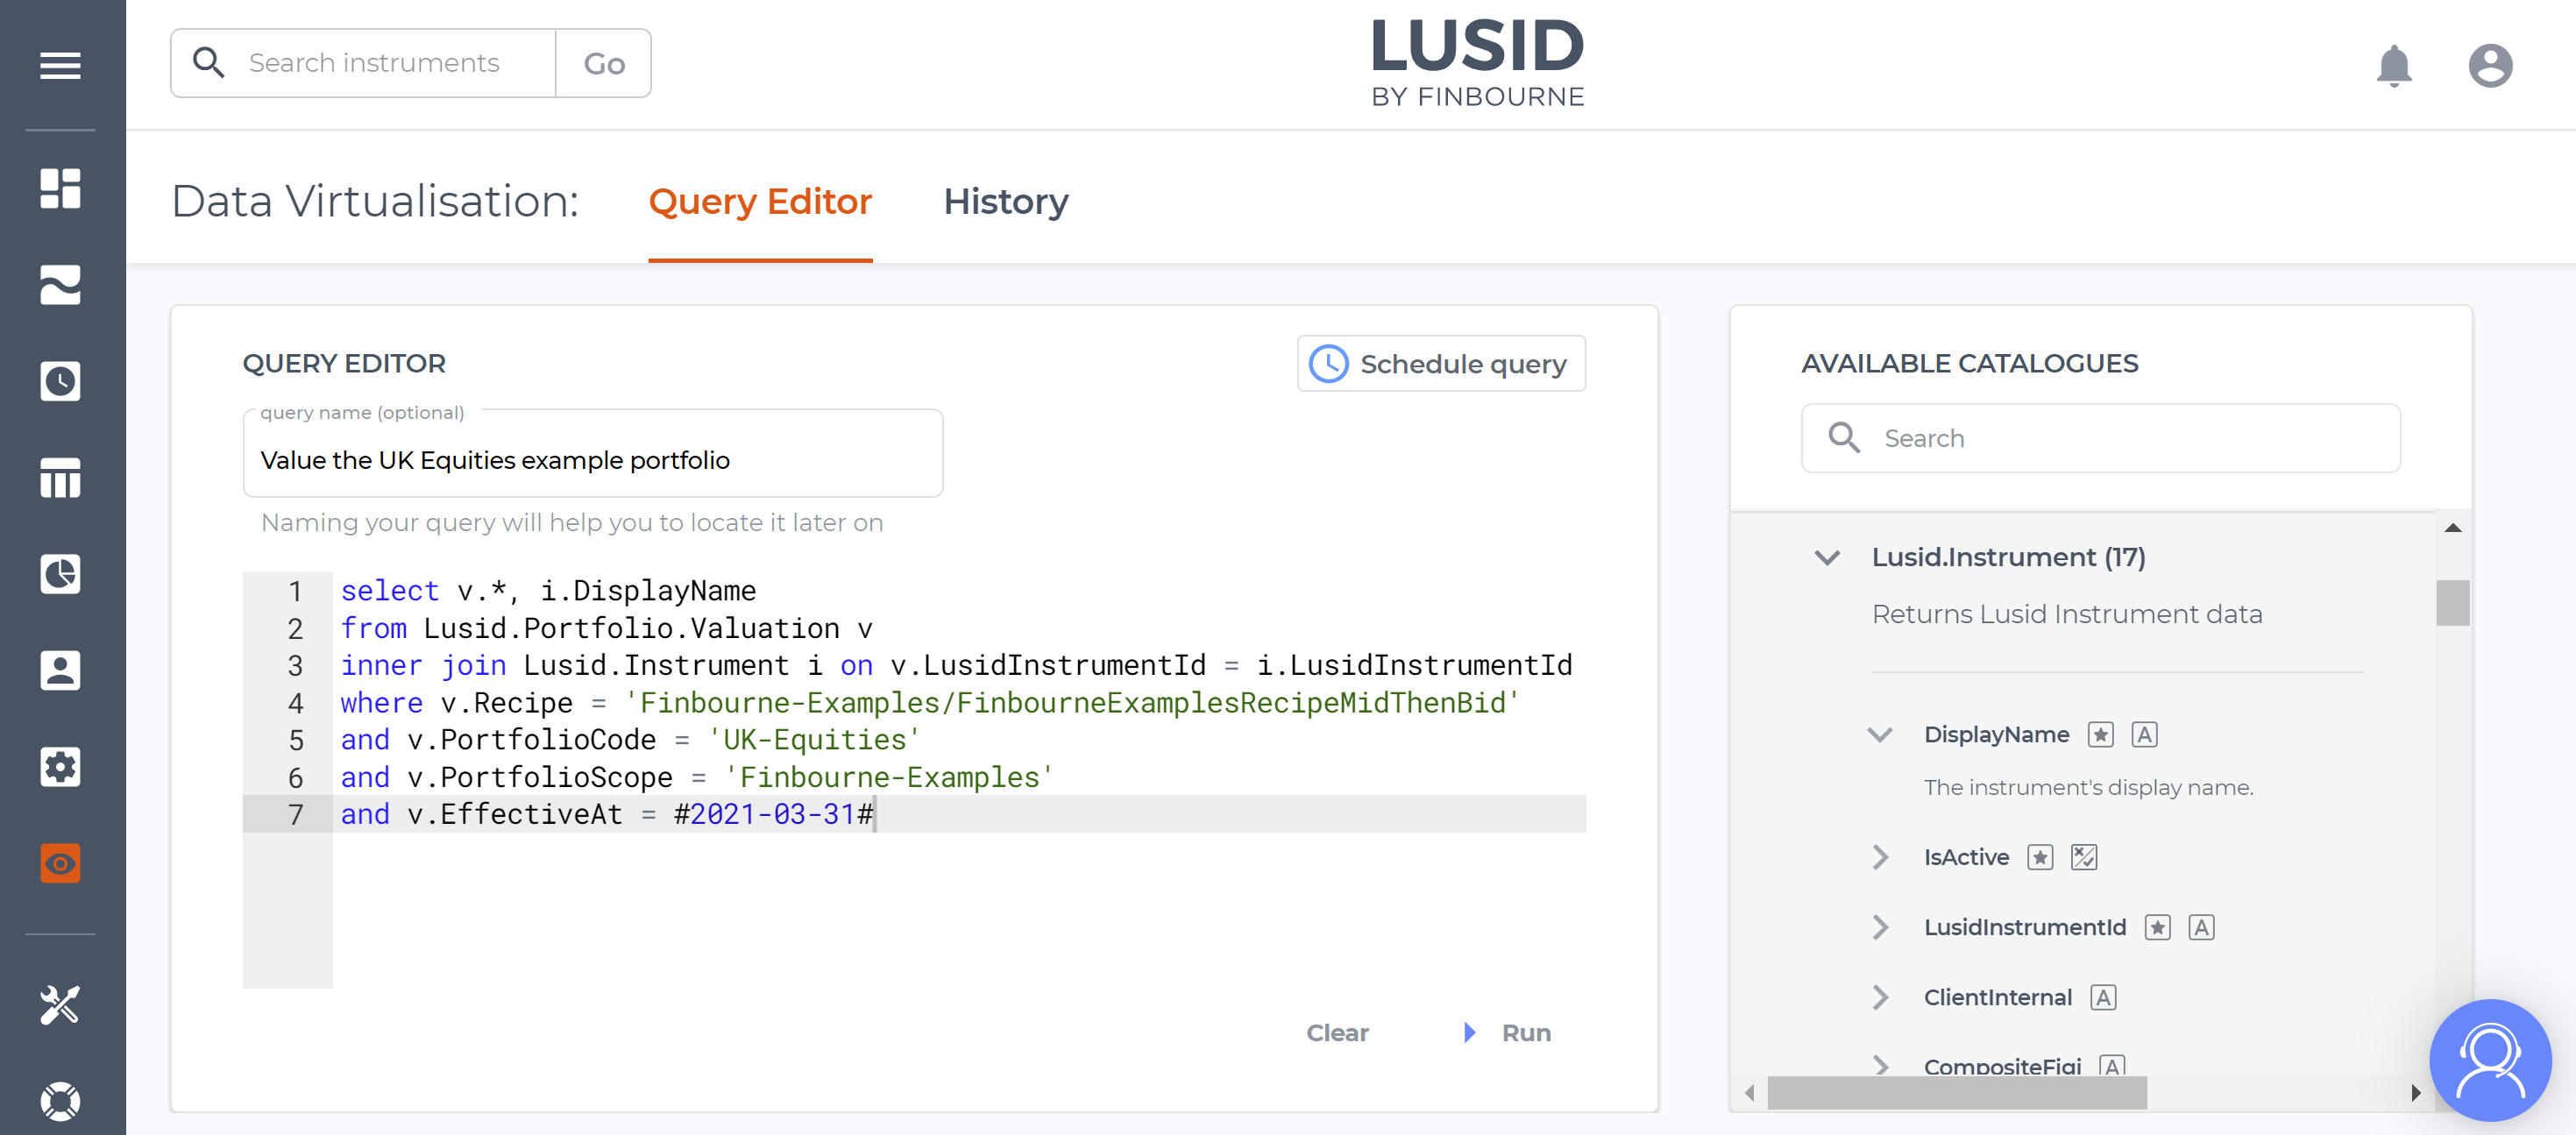
Click the Run button again to view the results on the History dashboard.
Click the
 Configure icon for the pie chart and this time choose a label of DisplayName, which should now be available in the Label dropdown:
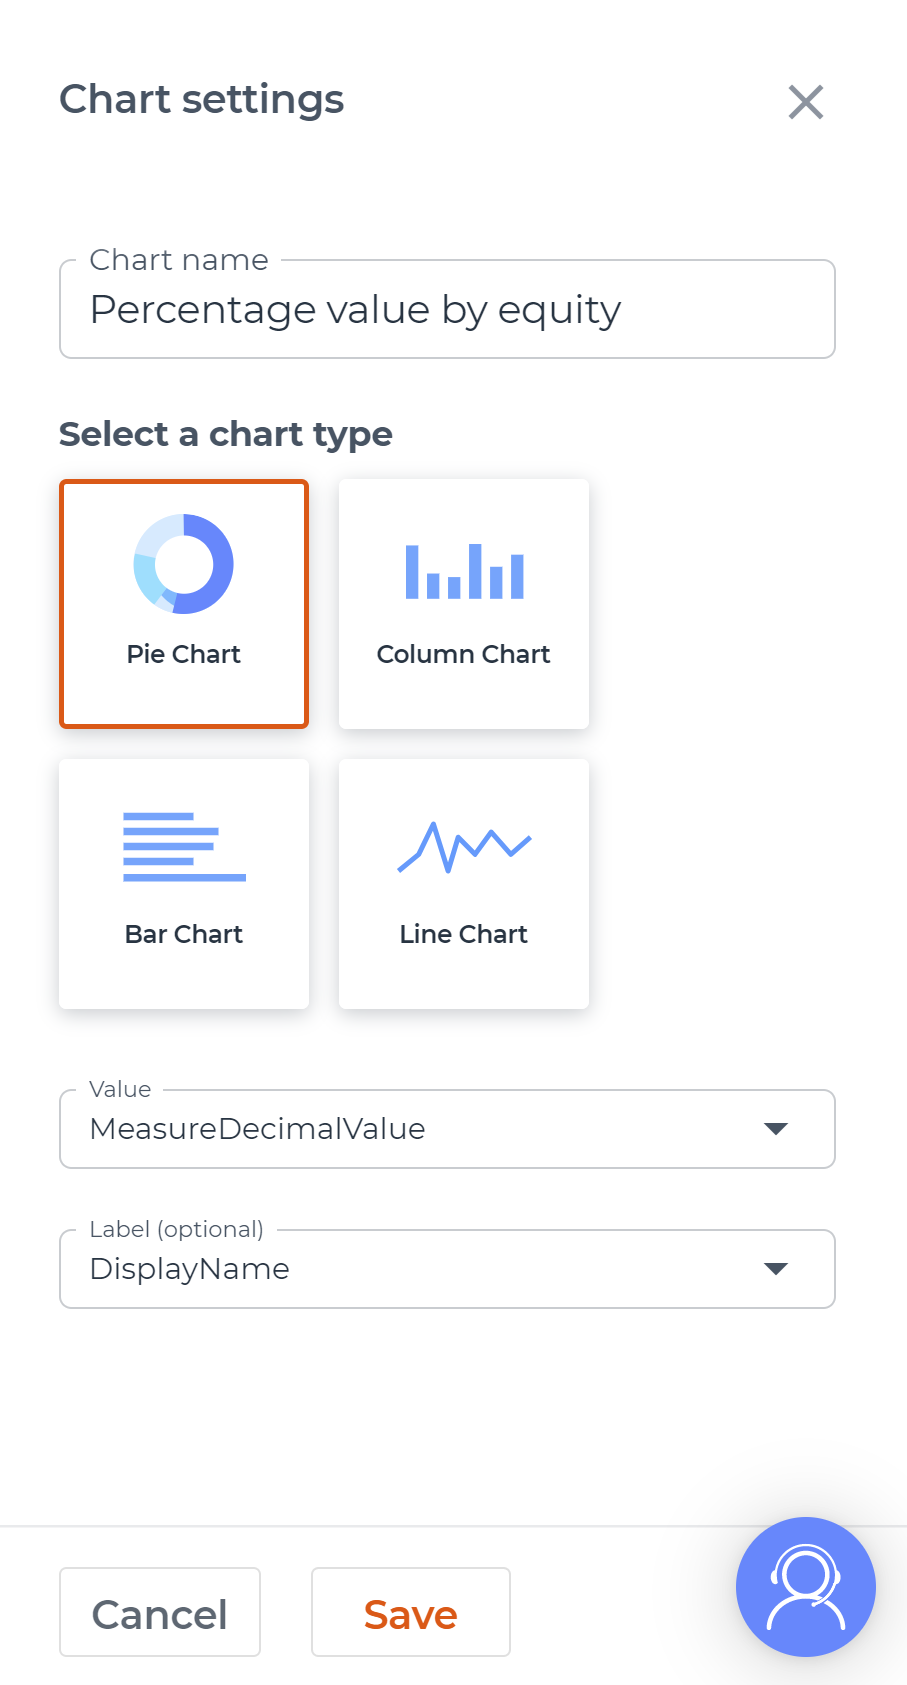
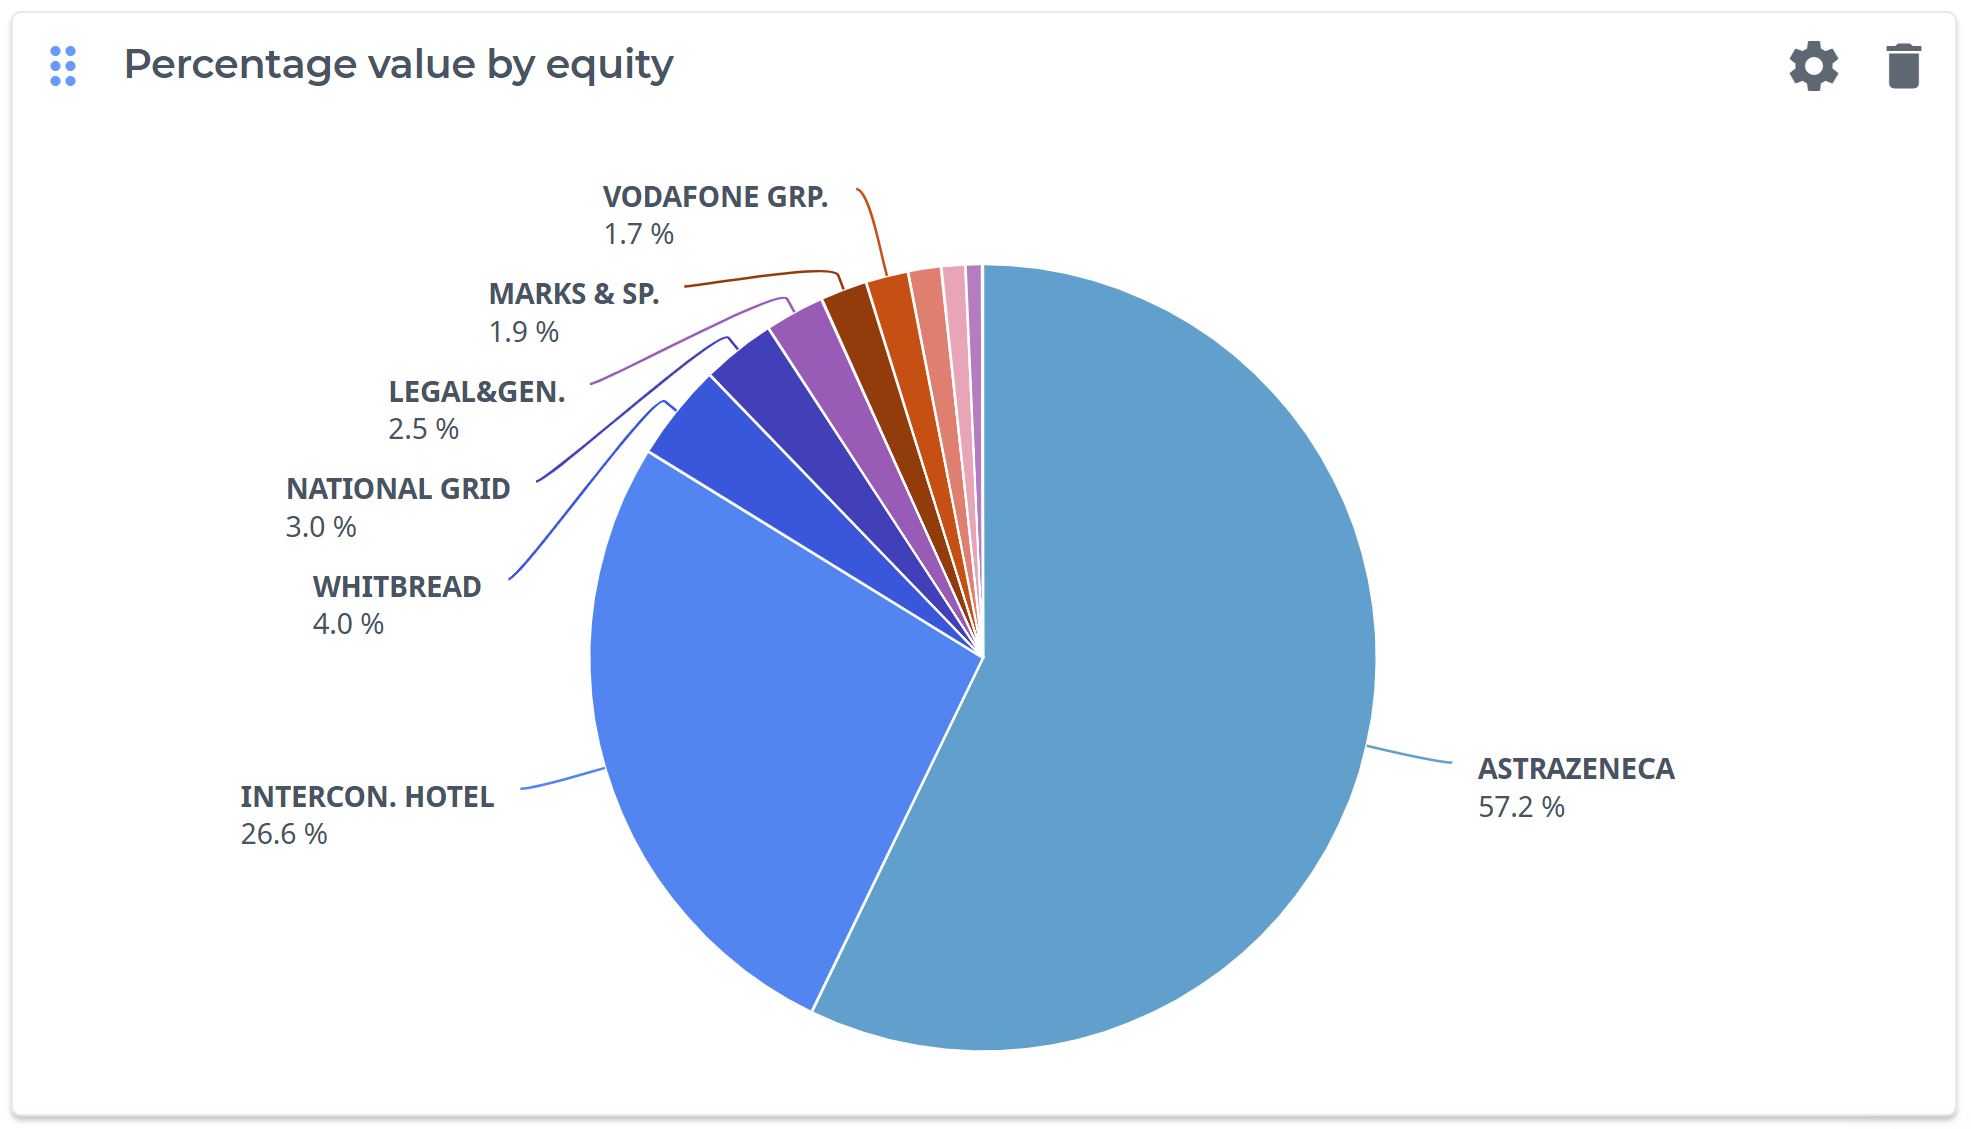
Click the Save button. The chart now reveals the most valuable equity in the portfolio:
Step 6: Downloading results in a convenient form
You can download the results table as a CSV file by clicking the ![]() Export icon (top right):
Export icon (top right):
You can also create a different version of the table by clicking the New Panel button (at the bottom) to replicate it:
You could then use the Columns widget (at the right) to show different columns, perform visual grouping, or perhaps re-arrange them, and export this other version.